MLOps, or Machine Learning Operations, is a set of practices that aims to streamline and optimize the lifecycle of machine learning models. It integrates elements from machine learning, DevOps, and data engineering to enhance the efficiency and effectiveness of deploying, monitoring, and maintaining ML models in production environments.
MLOps enables developers to streamline the machine learning development process from experimentation to production. This includes automating the machine learning pipeline, from data collection and model training to deployment and monitoring. This automation helps reduce manual errors and improve efficiency.
Our team added this feature to OptScale to foster better collaboration between data scientists, machine learning engineers, and software developers.
- A run is a single iteration of a task. For example, you set the parameters of the training code and launch it for training. A new entry appears in OptScale for this launch.
- A task allows you to group several Runs into one entity to view them conveniently.
How to view training results in OptScale
A task is the primary unit of organization and access control for runs; all runs belong to a task. Tasks let you visualize, search for, and compare runs and access run metadata for analysis.
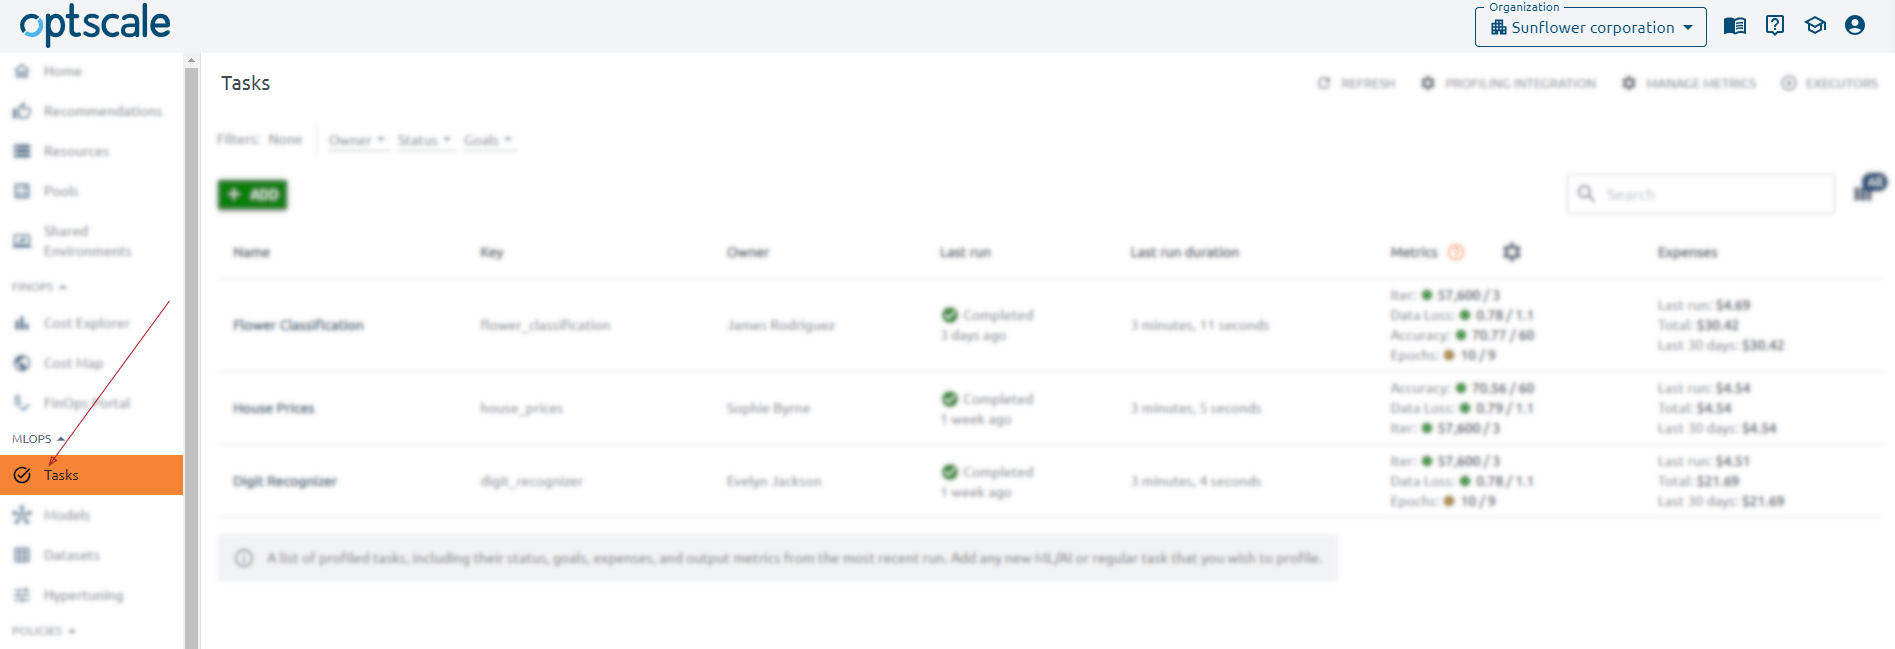
Find already created tasks on the Tasks page of the MLOps section of the menu.
👉🏻 How to create and add ML tasks in the OptScale Tasks section? Learn more here → https://optscale.ai/how-to-add-tasks-in-mlops-in-optscale/
The Tasks page contains a list of profiled tasks, including their key, status, goals, expenses, and output metrics from the most recent run.
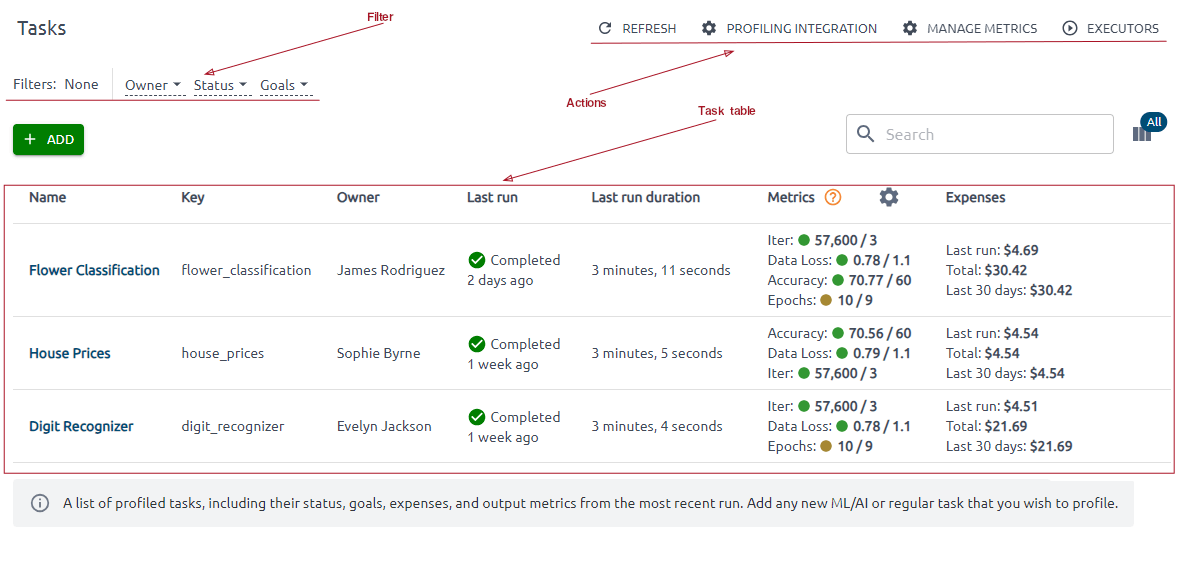
You can also set filters and take action. Profiling Integration action gives you complete instructions on successfully launching code on your instance to get the result.
Use Manage Metrics to add or edit metrics. Here, you can define a set of metrics against which every module should be evaluated. You can also set a target value and tendency for each captured metric.
Behind the Executors button hides the Executors’ list, showing you compute resources used to run your ML activities.
You can see information about some tasks by clicking on its name.

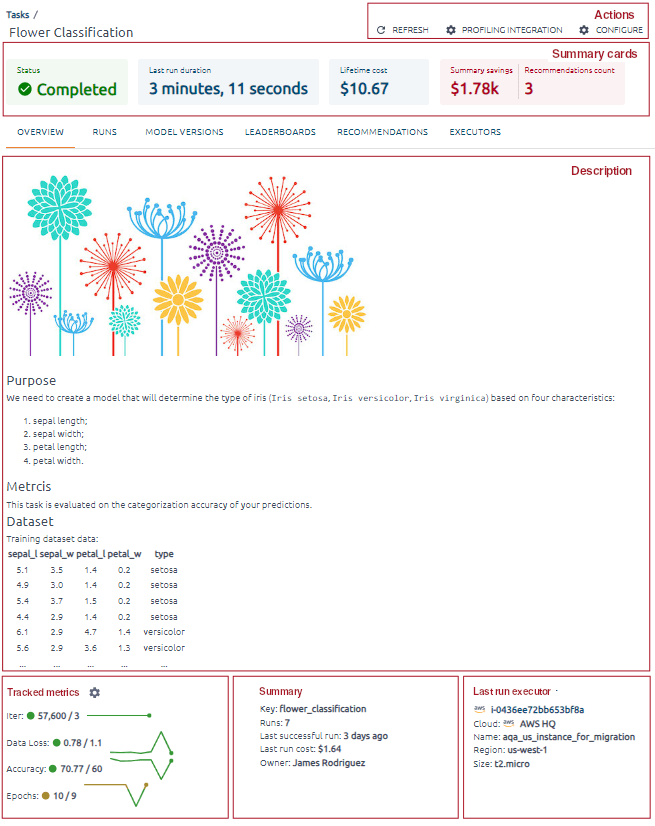
Summary cards contain information about the last run status, last run duration, lifetime cost (the cost of all runs in the task), and recommendations (recommendations for instances used as executors).

Let’s take a closer look at the Tracked Metrics section.
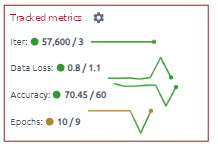
Tracked metrics are a graphical representation of all runs and specific numbers for the last run.
The green circle indicates that the metric has reached the target value under the tendency, while the brown one demonstrates that it has not. After that, the last run value/target metric value line values for all task runs follow.
The Last run executor shows on which instance the last run was executed.
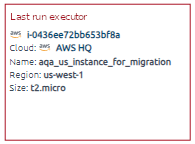
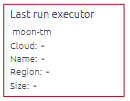
If the executor is known to OptScale, you will receive complete information about it and its expenses. If the executor is unknown to the OptScale, then some information about it will be unavailable.
Please note that supported clouds are AWS and Azure only.
The section will look like it is shown below:
What does the Runs tab display
On the Runs tab, find all the information about the task’s runs.
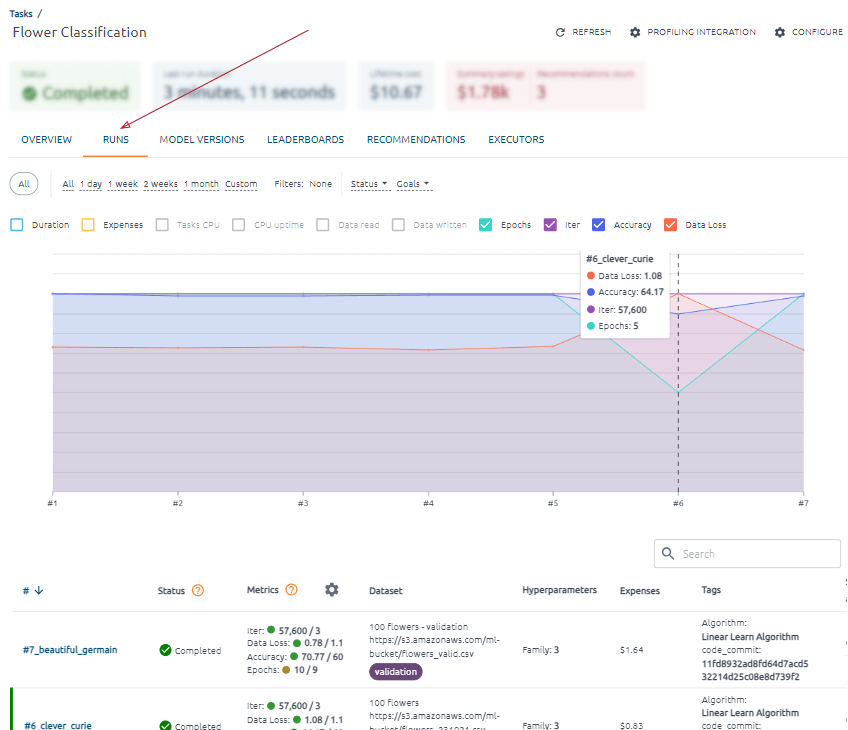
The first thing you’ll see on this page is a graph.
You can filter the data using filters by time period, status, and goals (goals met, goals not met).
You can choose which data will be displayed by clicking on the corresponding selectors. Duration, Expenses, and Metrics attached to the task are available for display.

The X-axis displays data points for each task run in the format #number_of_run.
The Y-axis displays the actual values of the indicators for the corresponding run. If two or fewer indicators are selected for display, units of measurement will be displayed. Hover your mouse over a trend line to see a tooltip with the data, metric name, actual value, and unit of measure for that data point.
Below the graph, you can see entries with all task runs.
A vertical green line on the right indicates a run for all metrics that have reached the target value according to the trend. This run achieved its goals.

Each run in the table is clickable.
For each run, you can see run status, metrics (only assigned metrics for the task), brief information about the run dataset, run hyperparameter, tags, and duration information.

Summary cards and an overview, charts, and executors information sorted into tabs are shown on this page.
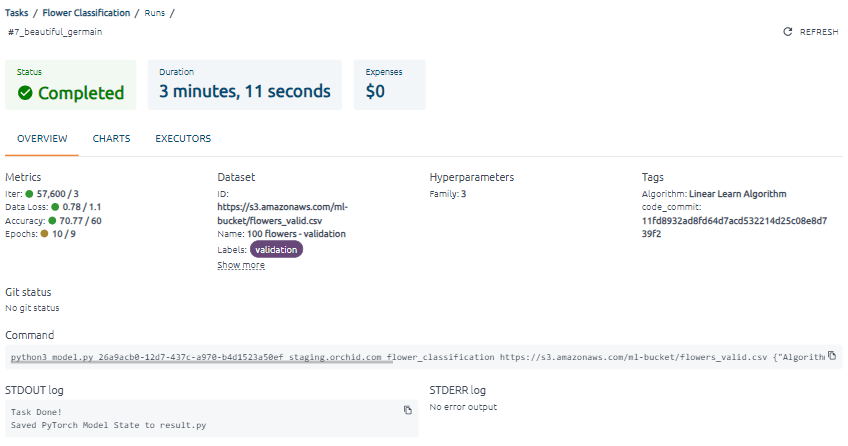
Summary cards of the run give information about status, duration, and expenses. The expenses summary card contains non-zero-value expenses if the training code was executed on a cloud executor known to OptScale (the corresponding data source is connected to OptScale). The cost will appear on the corresponding card after expenses for this resource are received.
The information is sorted into tabs. The Overview tab Data blocks the last metrics values, dataset info, hyperparameters, tags, git status, command, and logs.
For each metric, the green circle indicates whether it has reached the target value under the tendency. If not, the brown circle is displayed.
The Model Versions and Executors tab contents
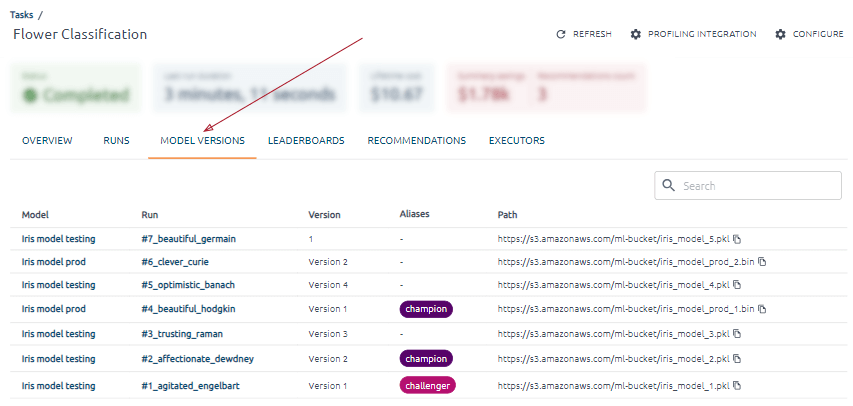
The Model Versions tab of the Tasks page shows all versions of models created in task runs.
All the executors on which the training code was executed are available on the Executors tab.

If some executor is known to OptScale, you will receive complete information about him and his expenses. Supported clouds are AWS and Azure.
For an unknown executor, some information will be unavailable.
OptScale, an open source platform with MLOps and FinOps capabilities, offers complete transparency and optimization of cloud expenses across various organizations and features MLOps tools such as tracking ML experiments, ML Leaderboards, versioning models, hyperparameter tuning → Try it out in OptScale demo
