Effective ways to debug and profile machine learning model training
- Edwin Kuss
- 6 min

Table of contents
- ML Model training explained: meaning, purpose, pitfalls & benefits
- Understanding AI model training
- Comparison table: ML model training vs. AI model training
- Prepare and explore your data
- Begin with a basic model
- Identify and fix data issues
- Detect and prevent overfitting
- Monitoring ML models training progress
- Leverage visualization tools for insights
- Profile models for optimal performance
- Speed up development with transfer learning
- Automate hyperparameter tuning for efficiency
- Validate models using fresh datasets
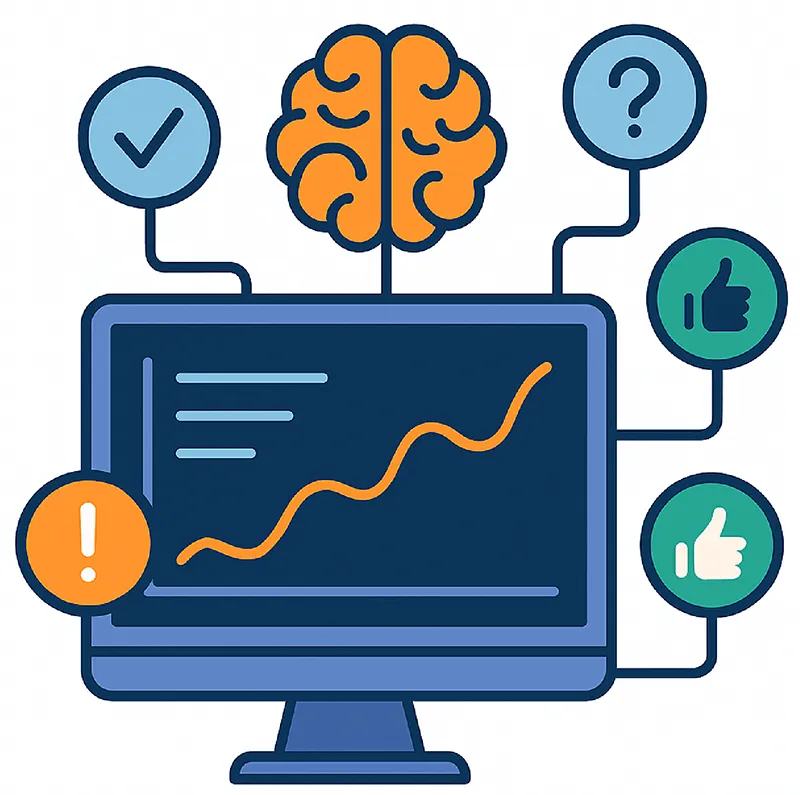
Machine learning (ML) models have become a cornerstone of modern technology, powering applications from image recognition to natural language processing. Despite widespread adoption, developing and training ML models remains intricate and time-intensive. Debugging and profiling these models, in particular, can pose significant challenges. This article delves into practical tips and proven best practices to help you effectively debug and profile your ML model training process.
ML Model training explained: meaning, purpose, pitfalls & benefits
What is model training?
ML model training is the process of feeding labeled or unlabeled data into an algorithm to learn statistical relationships and make accurate predictions.
During training, the model:
- Processes input examples;
- Compares predictions to the expected output;
- Adjusts weights to reduce error;
- Repeats the cycle until performance stabilizes.
Training can happen on CPUs or GPUs and often requires multiple iterations, experiments, and hyperparameter adjustments.
What it is used for
Training enables ML systems to:
- Predict outcomes (e.g., fraud detection, churn prediction, demand forecasting)
- Classify objects (images, text, events)
- Recognize patterns in large volumes of structured or unstructured data
- Make decisions at scale without explicit rules
- Improve over time as new data becomes available
In short, training transforms raw data into a model capable of solving real-world tasks.
Common pitfalls in ML model training
Training ML models is complex, and several recurring challenges can degrade results:
Data quality issues
Missing values, mislabeled samples, and inconsistent preprocessing can dramatically reduce accuracy.
Overfitting or underfitting
A model may learn the training data too well (overfit) or fail to capture underlying patterns (underfit).
Improper hyperparameter selection
Poor choices around learning rate, batch size, or architecture often lead to unstable or slow training.
Hardware bottlenecks
Insufficient GPU memory, CPU contention, or low I/O throughput extend experiment cycles and slow iteration.
Lack of experiment tracking
Without systematic tracking, teams cannot reproduce results or understand why one experiment outperforms another.
Unoptimized training pipelines
Inefficient data loading, large batch transfers, and unnecessary model complexity inflate costs and slow training.
Benefits of effective training ML models
When done correctly, training enables teams to build models that are reliable, scalable, and valuable in production.
Higher model accuracy
Systematic training processes produce models that generalize better to new data.
Shorter experiment cycles
Optimized pipelines and hardware utilization significantly reduce the time-to-results.
More reproducible workflows
Precise tracking of datasets, hyperparameters, and code ensures models can be recreated months later.
Operational efficiency
Teams spend less time debugging training bottlenecks and more time improving model logic.
Stronger business impact
High-quality training leads to better predictions — enabling automation, personalization, and decision-making at scale.

Understanding AI model training: Purpose, Challenges, and Key Benefits
AI model training is the process through which an algorithm learns patterns from data so it can make predictions or decisions without being explicitly programmed. During this learning phase, the model adjusts internal parameters to minimize errors and improve accuracy. High-quality training is the foundation of any reliable AI system, from recommendation engines to fraud detection tools and generative models.
Training is not just a technical step — it defines how well an AI system will perform in real-world conditions, how robust it remains over time, and whether it can generalize beyond the examples it has seen.
What AI model training is
AI model training involves feeding structured or unstructured data into an algorithm, evaluating outputs, and iteratively optimizing parameters until the model reaches acceptable performance.
The process typically includes:
- preparing and preprocessing datasets
- selecting and configuring model architectures
- defining loss functions and optimization strategies
- iteratively learning from data to minimize errors
This phase results in a trained model ready for validation, testing, and later deployment.

Why organizations train AI models
AI model training enables businesses to:
- Automate decision-making by teaching systems to classify, predict, or recommend
- Extract insights from large datasets that are impossible to process manually
- Enhance accuracy and efficiency across processes like document parsing, risk scoring, anomaly detection, and personalization
- Adapt solutions to domain-specific needs through fine-tuning on proprietary data
Well-trained models directly influence business outcomes, improving service quality and operational efficiency.
Challenges in building high-quality AI models
Training AI models comes with several recurring challenges:
- Poor data quality (missing values, noise, biases) leads to inaccurate or unfair predictions
- Overfitting occurs when the model memorizes training data instead of generalizing
- Underfitting happens when the model is too simple to capture real patterns
- Insufficient experiment tracking makes it difficult to reproduce results or understand why a model performs better
- Lack of monitoring after training causes gradual degradation when real-world data shifts
Avoiding these issues requires structured MLOps practices, versioning, and rigorous evaluation.

Benefits of effective AI model training
High-quality AI training delivers long-lasting advantages:
- Better predictive performance and more reliable business outcomes
- Greater adaptability, as models can be retrained or fine-tuned on new data
- Improved reproducibility through systematic experiment tracking
- Lower operational risks, because well-trained models behave more predictably in production
- Faster iteration cycles enabled by clear workflows and scalable training infrastructure
In short, effective training creates AI systems that are more accurate, stable, and easier to maintain — especially as data evolves over time.
Comparison table: ML model training vs. AI model training
|
Aspect |
ML model training |
AI Model Training |
|
Core Definition |
The process of teaching a machine learning model to recognize patterns using labeled or unlabeled datasets. |
The broader process of enabling AI systems — often using ML, deep learning, or neural networks — to learn, reason, and generalize from data. |
|
Primary Purpose |
Build a predictive model that performs a single, well-defined task (e.g., classification, regression). |
Develop more complex systems capable of perception, decision-making, or multi-step reasoning (e.g., LLMs, multimodal models). |
|
Typical Techniques |
Linear models, tree-based algorithms, supervised/unsupervised learning, feature engineering. |
Neural networks, deep learning architectures, reinforcement learning, multimodal training. |
|
Data Requirements |
Requires structured or moderately large datasets; feature engineering is usually essential. |
Requires massive, diverse datasets; often relies on automated representation learning instead of manual feature engineering. |
|
Common Pitfalls |
Overfitting, data leakage, poor preprocessing, unbalanced datasets. |
High compute costs, bias amplification, training instability, alignment issues, safety concerns. |
|
Training Challenges |
Choosing the right features, tuning hyperparameters, and ensuring reproducibility. |
Managing large-scale infrastructure, distributed training, ensuring safety and controllability. |
|
Evaluation Focus |
Accuracy, precision/recall, RMSE, F1-score — depending on task type. |
Capability evaluations (reasoning, instruction-following), robustness, hallucination rate, safety benchmarks. |
|
Key Benefits |
Efficient predictions for narrow tasks; easy deployment and iteration cycles. |
Enables advanced automation, generalized reasoning, and complex decision-making. |
|
Where Used |
Fraud detection, predictive maintenance, recommendation scoring. |
Conversational AI, autonomous systems, generative models, multimodal assistants. |
Prepare and explore your data
Before delving into debugging and profiling, it’s crucial to fully comprehend the data used for training your machine learning (ML) model. This involves evaluating its format, size, and distribution and identifying any potential biases or anomalies. A deep understanding of the data highlights potential issues and informs preprocessing and feature engineering strategies. To ensure effective model training, focus on preparing the data to include only the most relevant and clear information.
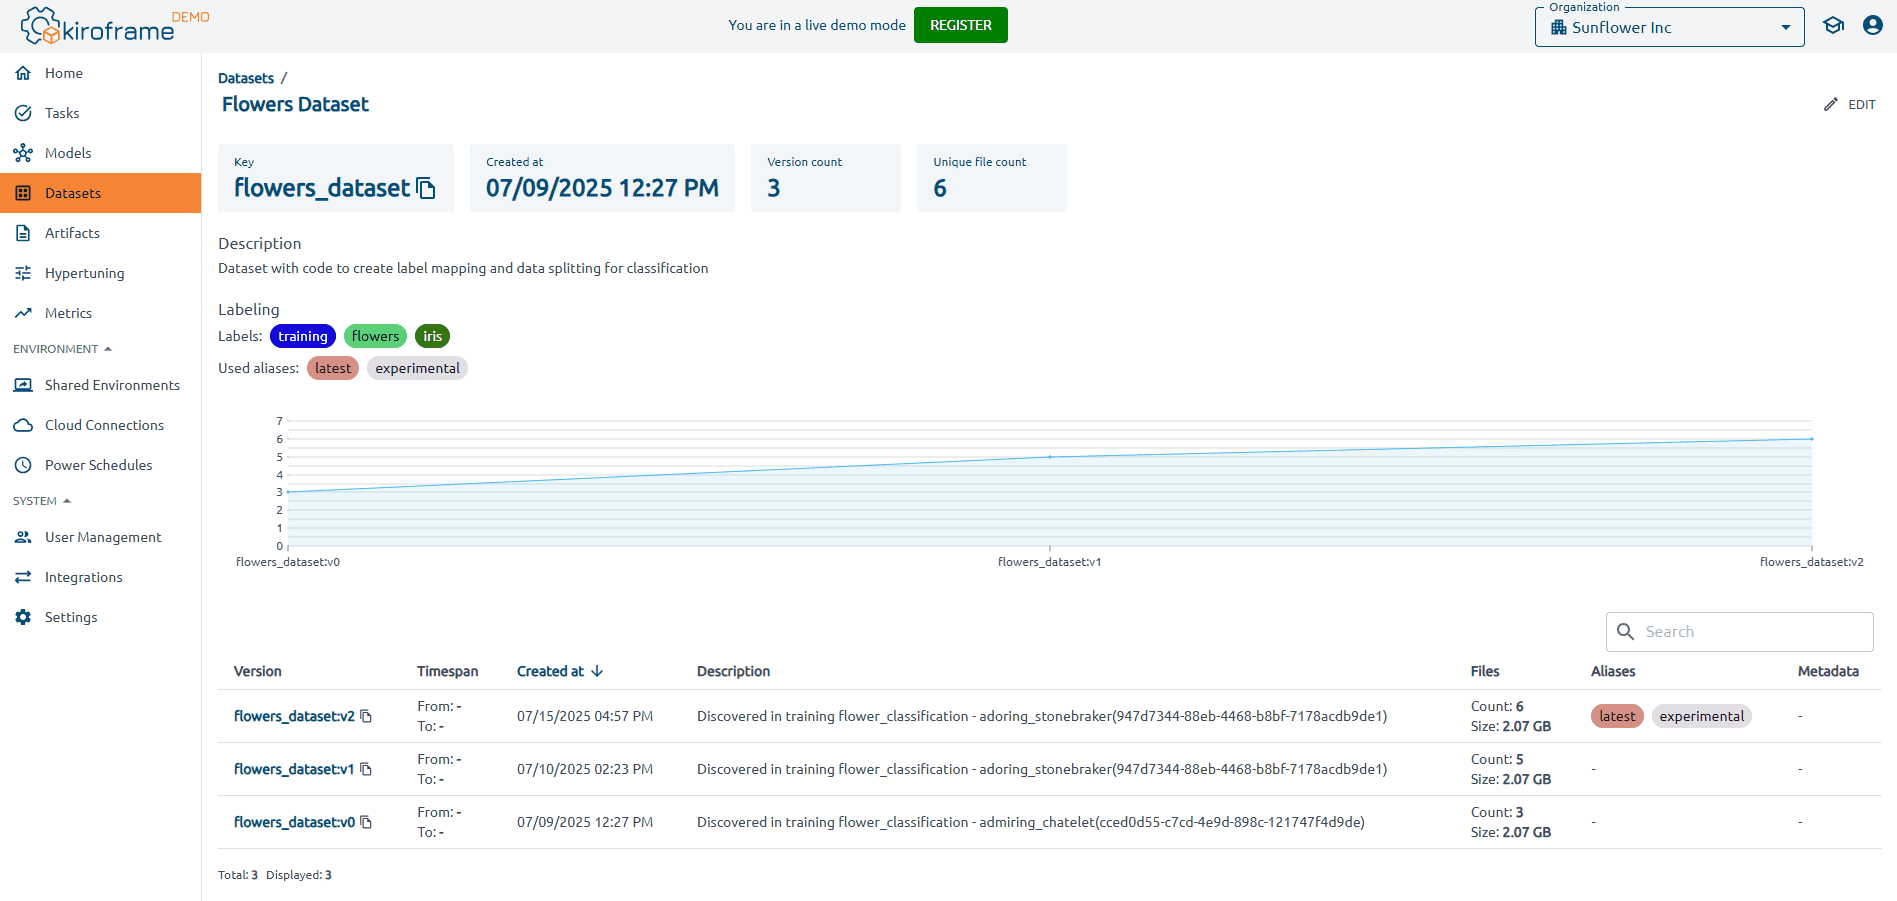
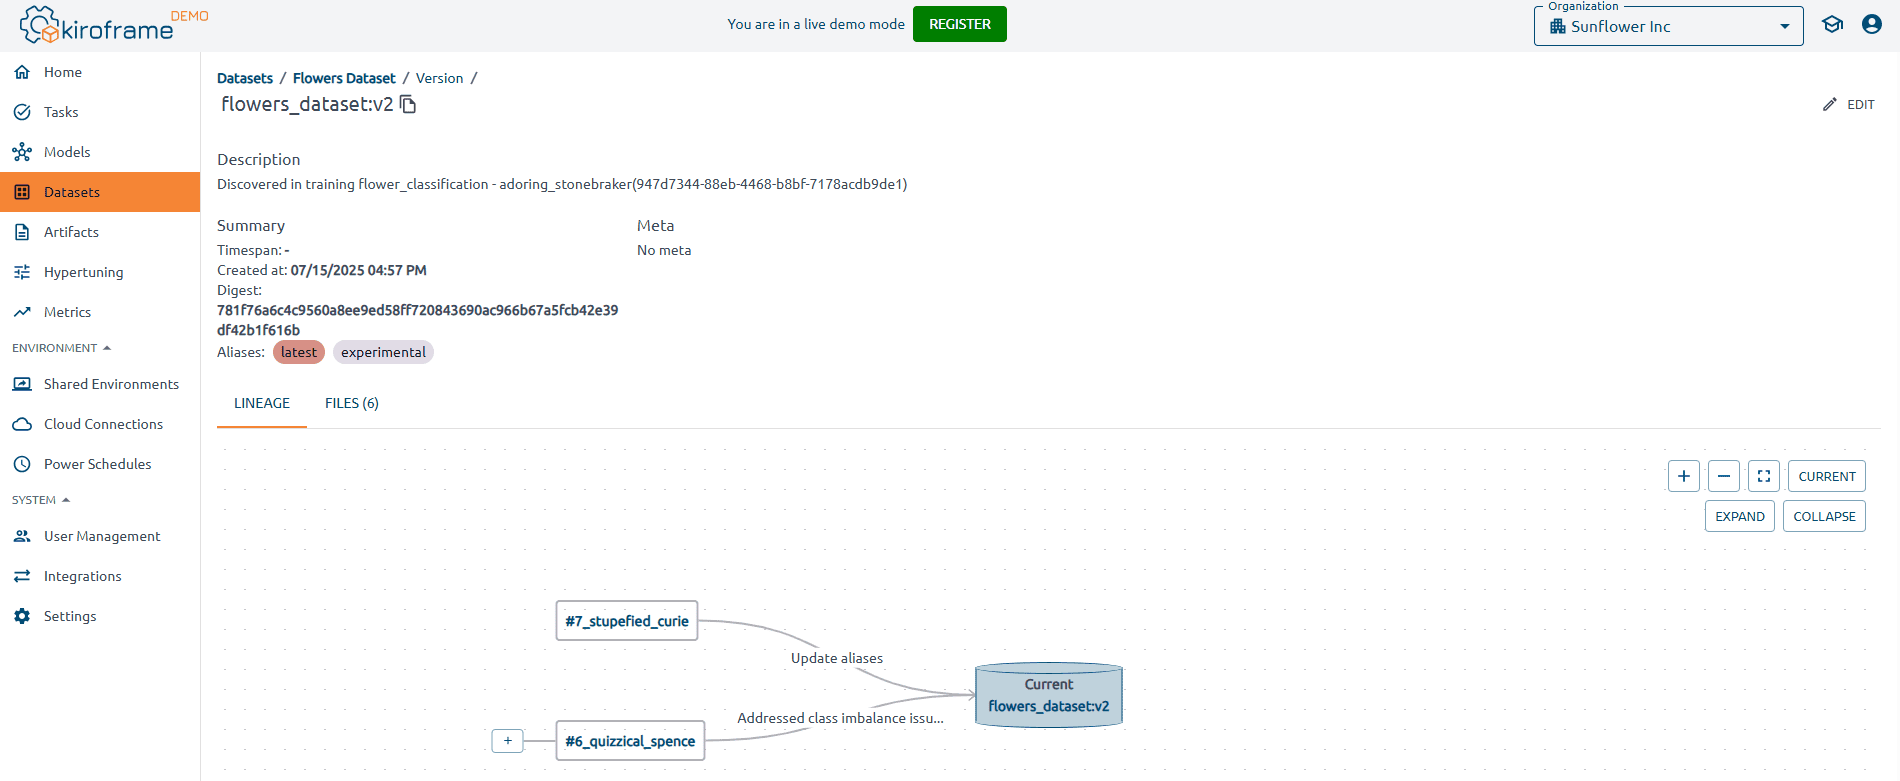
With Kiroframe’s dataset tracking and management, teams can link datasets to model runs, version changes, and monitor usage over time. This makes it easier to spot anomalies, track metadata, and ensure that experiments always run on the correct data snapshot. By adding transparency and reproducibility to the data preparation stage, Kiroframe helps prevent silent errors and accelerates the path to cleaner, more reliable ML models.
Begin with a basic model
Begin your ML development process with a straightforward model before gradually increasing complexity. A simple model helps you identify issues early and simplifies the debugging process. Once this baseline model is working as expected, you can incrementally introduce additional layers of complexity to build a more sophisticated system.
Identify and fix data issues
Data quality issues are a frequent cause of errors in ML models. Common problems include missing values, inconsistent formatting, and outliers. Conduct a thorough inspection of the dataset to identify and resolve these issues. Cleaning and normalizing the data are examples of proper preprocessing that guarantees the model is trained on reliable and consistent inputs.
With Kiroframe’s dataset tracking and management, teams can go beyond manual checks by versioning datasets, monitoring metadata, and linking data directly to training runs. This ensures that anomalies are detected earlier, preprocessing steps remain reproducible, and data quality improvements are consistently applied across experiments — leading to more trustworthy and accurate ML models.

Detect and prevent overfitting
Overfitting occurs when a model performs exceptionally well on the training data but struggles with new, unseen data. This is a common challenge, especially with complex models or limited datasets. To prevent overfitting, split your dataset into training and validation subsets and monitor performance on both. Use techniques like regularization, cross-validation, and early stopping to address overfitting effectively.

Monitoring ML models training progress
Monitoring your ML model’s training progress is vital to detect issues promptly. Track key metrics such as accuracy, loss, and convergence rate throughout training. If the model doesn’t perform as expected, revisit and refine aspects such as architecture, hyperparameters, or data preprocessing strategies to improve outcomes.
With Kiroframe, you can automatically log metrics and artifacts for every run, making it simple to compare experiments side by side on a shared leaderboard. This transparency helps teams spot regressions, reproduce results, and collaborate more effectively, ensuring that training progress isn’t just observed but also documented and actionable for long-term improvements.

Leverage visualization tools for insights
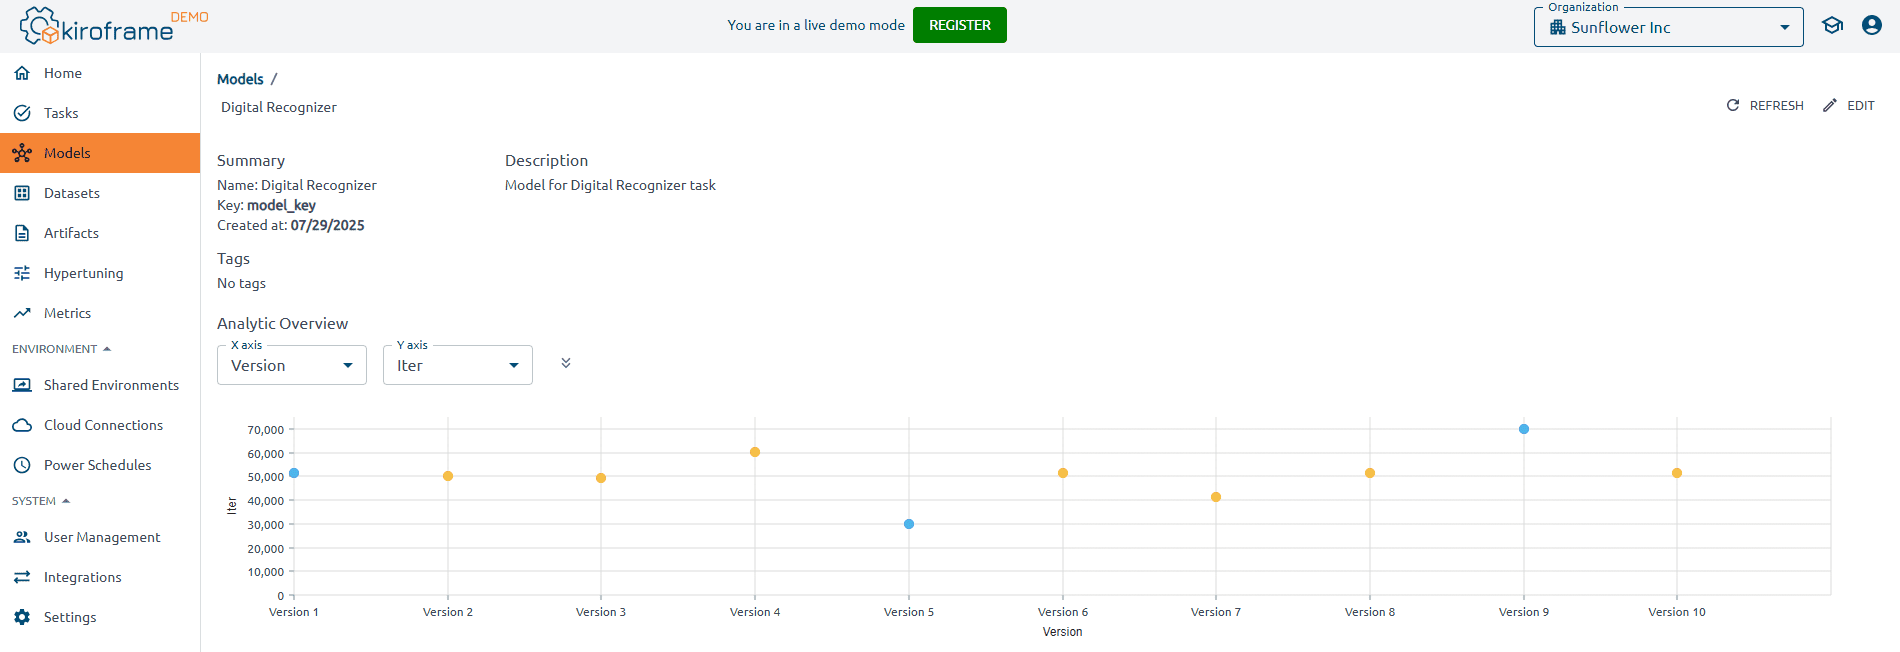
Visualization tools are invaluable for understanding your ML model’s behavior and identifying potential issues. Scatter plots, histograms, and heat maps can reveal patterns and anomalies in your data or model outputs. Platforms like Kiroframe, an MLOps solution, offer comprehensive insights by capturing detailed metrics and visualizing the entire ML/AI training process.
Beyond raw plots, Kiroframe links metrics to specific model runs and datasets, ensuring that insights are always reproducible. Shared leaderboards make it easy to compare results across experiments and team members, while advanced profiling highlights where resources are consumed. This combination of visualization, tracking, and profiling empowers teams to not only identify complex training issues but also optimize workflows with complete transparency and collaboration.
Profile models for optimal performance
Profiling an ML model is essential for identifying bottlenecks and areas for improvement. This action includes analyzing computational performance, memory usage, and I/O operations. Profiling tools provide insights into where the model spends most of its time, enabling targeted optimizations.
Tools like Kiroframe offer advanced profiling capabilities by capturing detailed runtime metrics across CPU, GPU, and memory usage while linking results directly to specific model runs. This gives teams full visibility into resource consumption and execution patterns, helping them pinpoint inefficiencies early. By combining internal and external performance metrics with version tracking, Kiroframe not only highlights bottlenecks but also ensures optimizations are reproducible and comparable across experiments — accelerating the path to high-performing, production-ready models.

Speed up development with transfer learning
Transfer learning is a powerful technique that applies knowledge from a pre-trained model to enhance the performance of a new one. This method is beneficial for creating intricate models or working with sparse data. Transfer learning accelerates training and improves overall model accuracy and efficiency by starting with a pre-trained model.
With Kiroframe, teams can streamline this process by versioning and reusing ML artifacts such as model weights and datasets, ensuring reproducibility across projects. Shared environment management and team-wide leaderboards further support rapid experimentation, making it easier to compare results, collaborate efficiently, and get the most out of transfer learning in production scenarios.
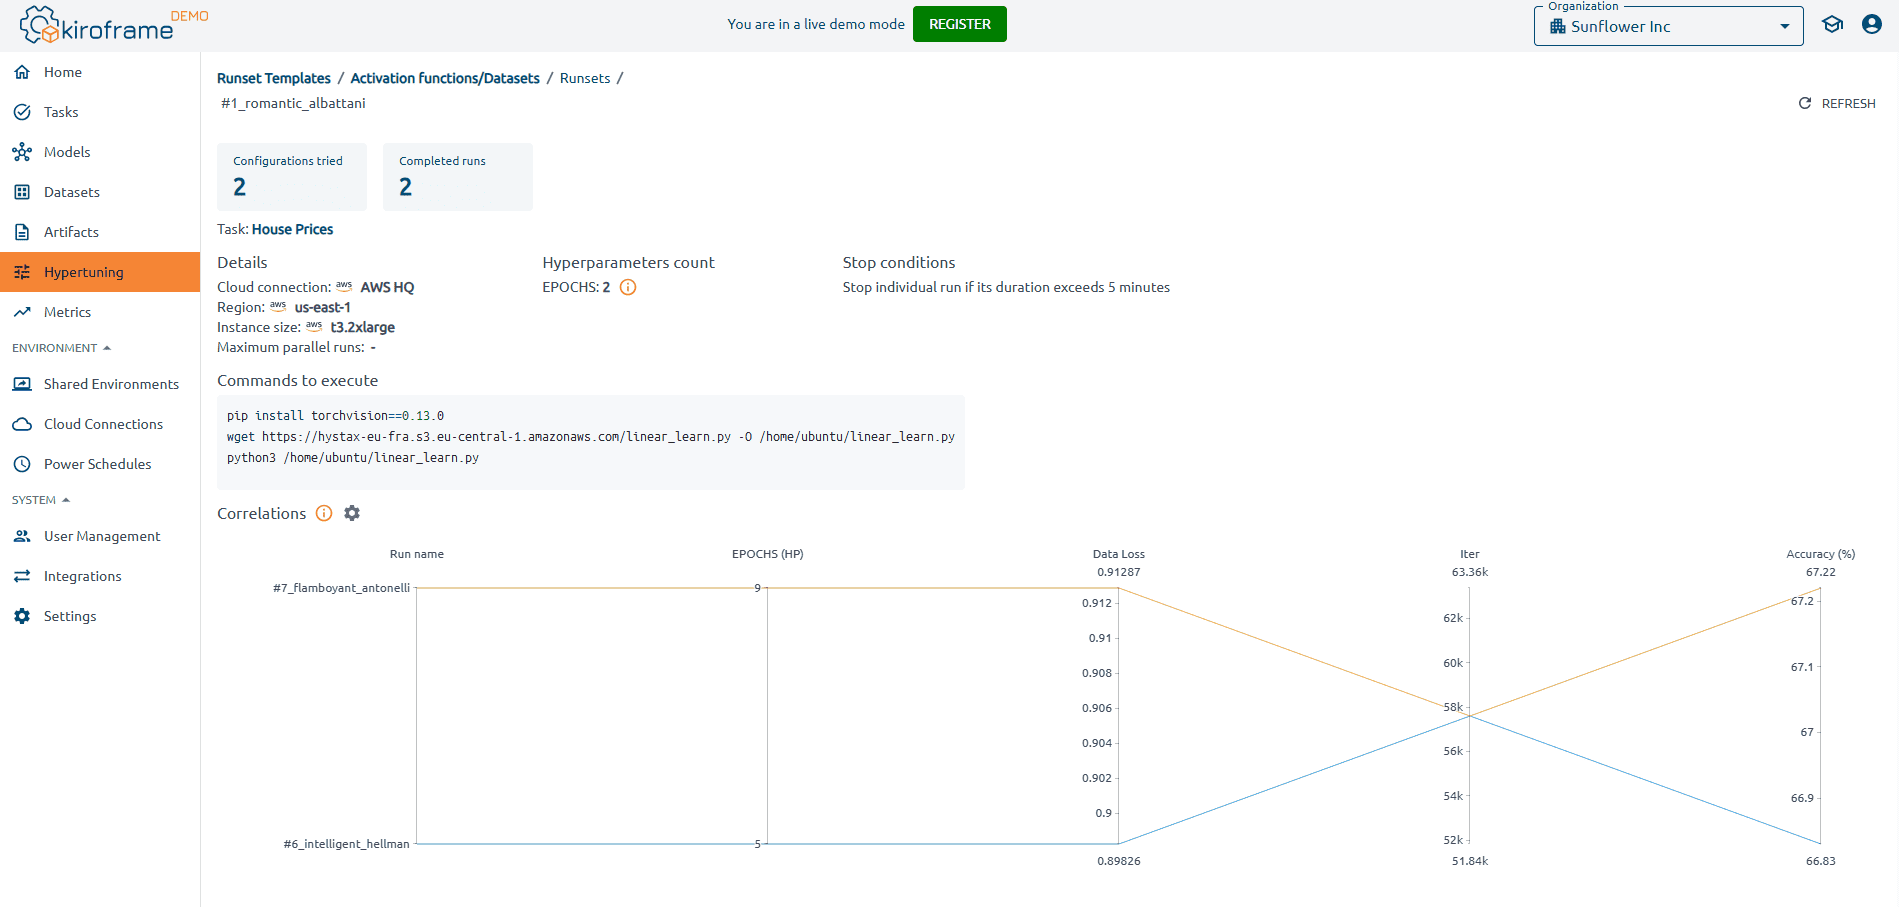
Automate hyperparameter tuning for efficiency
Hyperparameter tuning, such as adjusting learning rate and batch size, is crucial for optimizing ML models but can be time-intensive. Automated hyperparameter tuning streamlines this process, quickly identifying optimal settings. Tools like Kiroframe enhance this process by profiling ML/AI models, optimizing hyperparameter configurations, and providing insights on hardware or cloud resource usage to achieve the best outcomes.
Validate models using fresh datasets
After training the model, testing it on new, unseen data is critical to evaluate its generalization ability. This stage improves the model’s efficacy and dependability by identifying possible problems and confirming that it operates as intended in practical situations.
With Kiroframe’s dataset tracking and management, teams can go further by linking datasets directly to model runs, versioning changes, and monitoring usage over time. This ensures that validation always happens against the right data snapshot, with complete transparency and reproducibility. By managing metadata and dataset evolution in one place, Kiroframe helps eliminate inconsistencies, reduce data leakage risks, and provide confidence that model validation mirrors real-world performance.