Calculating the ROI of AI looks like a one-line formula. In practice, almost every input to that formula is missing, scattered across budgets, or supplied by the people whose tools are being evaluated. That is why so many AI business cases stall at the moment someone asks for the number behind the claim.
This is not a rare failure. In June 2025, Gartner predicted that more than 40% of agentic AI projects would be canceled by the end of 2027, citing escalating costs, unclear business value, and inadequate risk controls. Unclear business value is a measurement failure before it is a technology failure. The projects are not necessarily bad, but nobody can prove they are good.
This guide walks through how to calculate AI ROI end to end: what belongs on the cost side, what counts as value, which KPIs feed the formula, the mistakes that make a figure collapse under questioning, and how to keep the measurement running instead of rebuilding it by hand each quarter. For where AI impact shows up across cost, efficiency, and risk, and how it differs by industry, see our companion article on the business impact of AI adoption.
First, it helps to understand why AI ROI is harder to calculate than the return on a typical technology investment.
Why Is AI ROI Difficult to Measure?
Standard IT investment analysis assumes predictable adoption, well-understood implementation timelines, and benefits that begin shortly after deployment. AI investments break all three assumptions, for three reasons.
Benefits are mostly indirect. When AI helps an engineer or a support agent work faster, the benefit shows up as extra capacity, not as a line-item cost reduction. Headcount rarely changes, because AI accelerates people rather than replacing them. Unless you track the extra output and connect it to shipped work, the value stays invisible.
Costs are distributed. Provider API fees from OpenAI, Anthropic, or Google are visible on a monthly statement. The rest — engineering time spent on prompts and RAG pipelines, infrastructure overhead, evaluation datasets, security and compliance work, change management and ongoing maintenance — is rarely aggregated into one view. Without disciplined tracking and cost attribution by team, organizations consistently undercount total cost of ownership (TCO).
Perception is unreliable. In a randomized controlled trial published in July 2025, METR had 16 experienced open-source developers work through 246 real issues in repositories they already knew well, randomly allowing or disallowing AI tools. The developers took 19% longer with AI. They had forecast a 24% speed-up beforehand and still believed, afterward, that AI had made them about 20% faster. It is one study, on early-2025 tools and mature codebases, and METR treats the result as a historical snapshot rather than a verdict. But it is the clearest available demonstration of why self-reported time savings cannot be an input to an AI investment ROI figure: if the people doing the work were wrong about the direction of the effect, a survey of them is not evidence.
How to Calculate AI ROI: Cost Inputs vs. Value Outputs
Separating proof from hope requires one formula applied consistently. The calculation itself is simple:
AI ROI (%) = (Total quantified value − Total cost of ownership) ÷ Total cost of ownership × 100
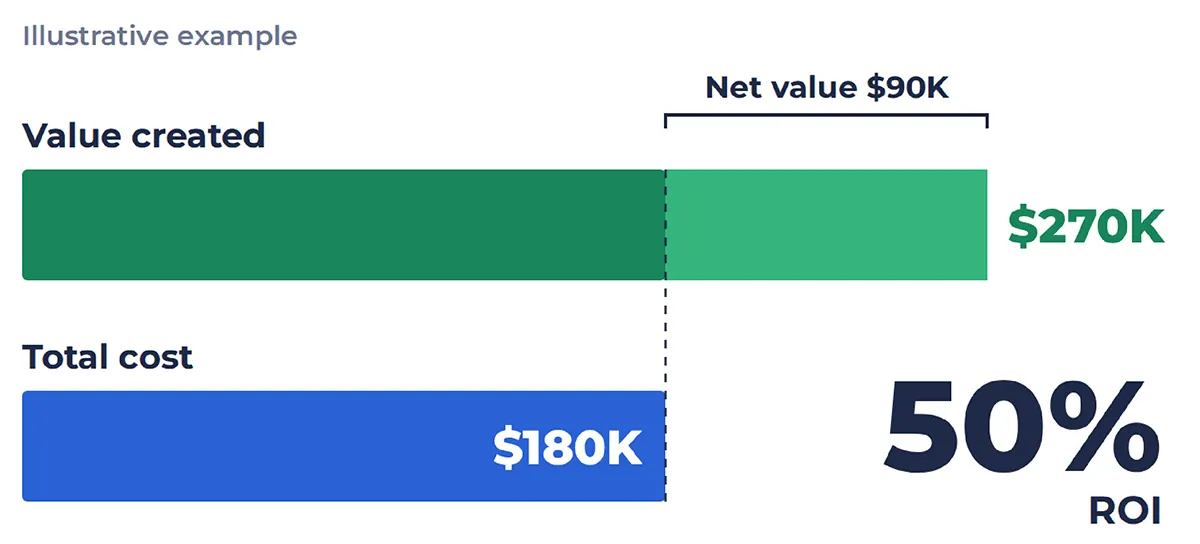
A worked example (illustrative). An internal support assistant costs $180,000 a year all-in: API spend, integration work, evaluation, and maintenance. Measured against the pre-AI baseline for the same queue, it deflects tickets worth $240,000 a year in agent time, and cuts overflow vendor fees by 30,000.ROI=(270,000 − $180,000) ÷ $180,000 × 100 = 50%.
The arithmetic is never the hard part. The inputs are. To calculate AI ROI credibly, you need four components:
• Value created — quantifiable efficiency gains, error reductions, revenue expansion and risk mitigation.
• Total cost of ownership — direct API costs plus development, infrastructure, evaluation, training, and operational maintenance.
• ROI and payback period — net value over time, expressed as months to payback and, for larger programs, net present value.
• Baseline benchmarking — output, speed and defect rates compared against a pre-AI baseline for the same team and the same kind of work.
For context: IDC's 2024 study commissioned by Microsoft, based on interviews with more than 4,000 business leaders, reported an average return of $3.70 for every $1 invested in generative AI, with top performers reporting $10.30 and organizations realizing value within about 13 months. Treat that as a ceiling set by adopters who chose to answer a survey, not as your own benchmark. It is self-reported, and the study is vendor-sponsored — exactly the kind of provenance a CFO will ask about, so state it before they do.
Cost Inputs vs. Value Outputs Matrix
Cost inputs (the true investment)
Value outputs (the business outcome)
Model and token spend: API calls, gateway hosting, prompt and completion token fees.
Direct cost reduction: deflected support tickets, reduced third-party vendor fees.
Engineering and integration: time spent on prompts, RAG pipelines, API glue code.
Capacity expansion: more output volume without adding headcount.
Infrastructure and compute: vector databases, caching layers, hosting.
Speed to market: shorter cycle time (for example, PR open-to-merge duration).
Maintenance and drift: edge-case fixes, prompt updates, model migrations.
Quality and risk reduction: lower defect escape rate, fewer SLA breaches.
AI ROI KPIs: What to Measure on the Value Side
The value side of the formula should be built from outcome KPIs, not activity counts such as "requests processed" or "active users". All figures below are illustrative; in practice, each should come from your own systems with its sample size and inclusion rules attached.
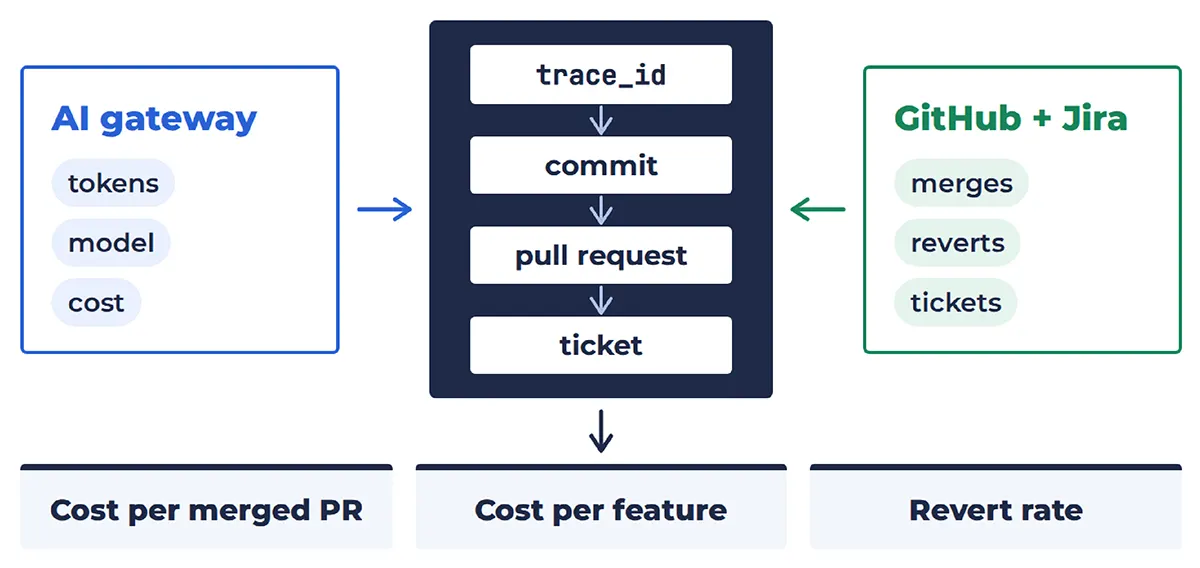
• Cost per output (cost per merged PR, cost per resolved ticket) — total model and infrastructure spend divided by completed, verified units of work. Illustrative: an engineering team spends $2,150 in API tokens over a month, and merges 125 pull requests, so its AI cost per merged PR is $17.20. For software teams, this unit deserves its own treatment; we cover how to build it, and the two metrics that belong beside it, in cost per merged PR as an AI ROI metric.
• Productivity gains (capacity lift) — the percentage change in completed work units per person over a period, against the pre-AI baseline. Illustrative: a legal team that drafted 10 contracts per attorney per week now drafts 14 with AI assistance — a 40% lift, provided the review rejection rate did not move.
• Revert and defect escape rate — how often AI-assisted code or content fails in production or needs post-merge remediation. If AI-assisted PRs are reverted more often than the team's baseline, the cost-per-output figure flatters the program until you price in that rework.
• Time saved (velocity) — the reduction in elapsed cycle time from task start to completion. Illustrative: median support resolution time falling from 24 hours to 4 hours per ticket.
• Payback period — the number of months until cumulative measured value covers cumulative cost. Illustrative: a program with a $90,000 build cost that then costs $40,000 a month to run and returns $55,000 a month in measured value pays back in six months.