Home#
Open Home to monitor cost, request volume, reliability, guardrail activity, and cache efficiency across the organization.
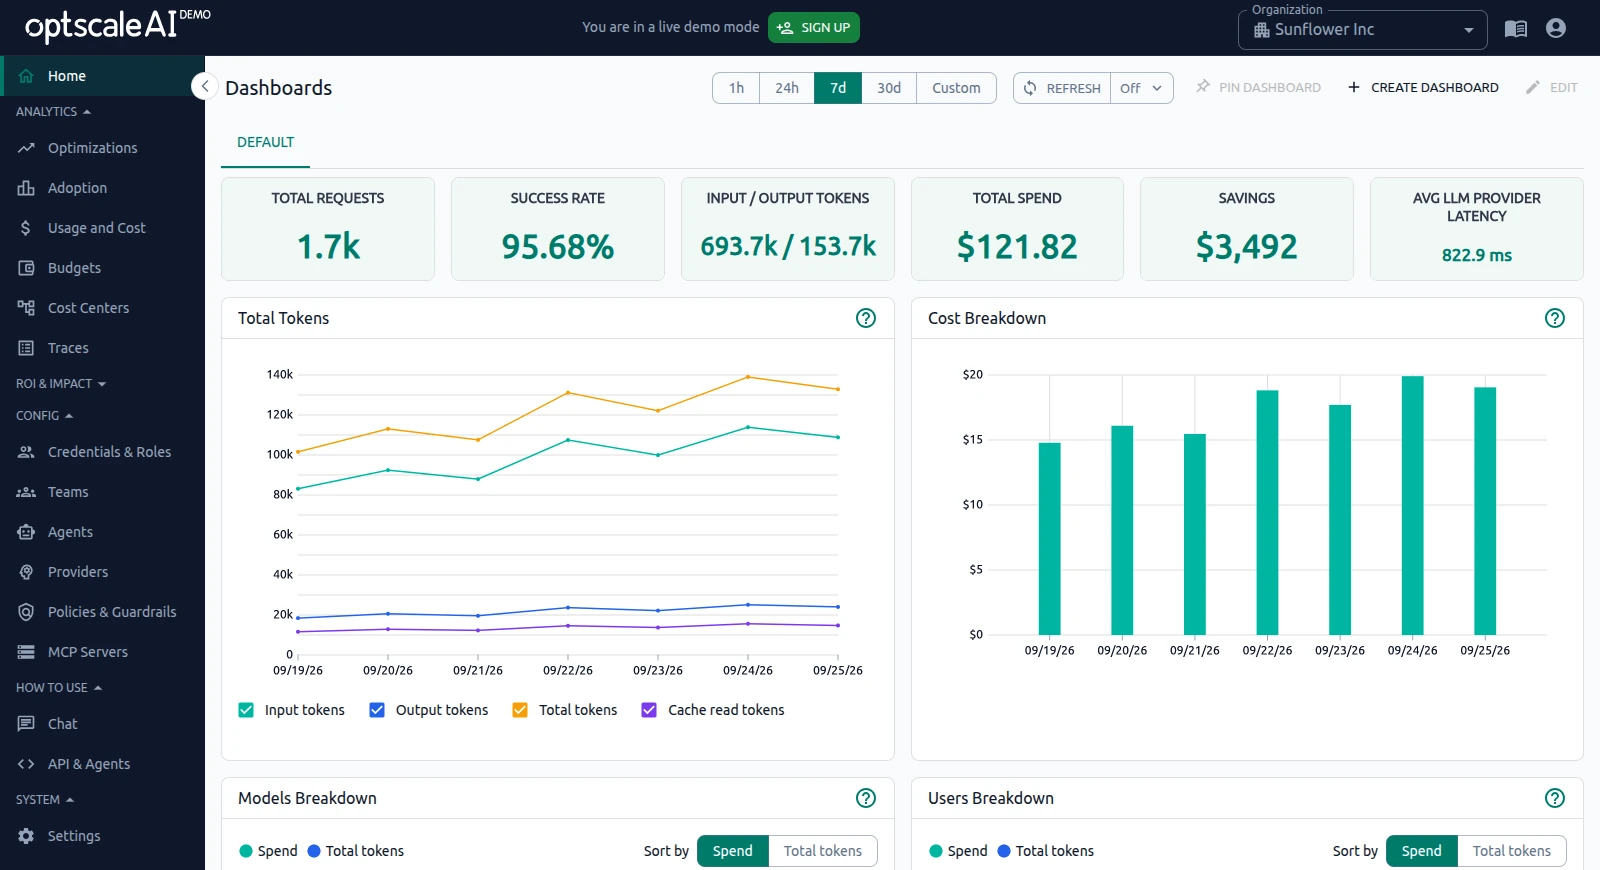
Use the dashboard for a high-level health check, then investigate specific trends in Usage and Cost, Optimizations, or Traces.
The Default dashboard is always available. Custom dashboards can be created to organize selected panels for specific monitoring needs.
Overview#
Default dashboard#
The Default dashboard provides a predefined view of key organization metrics and trends for the selected time range, including:
- Cost and Usage Summary — Requests, success rate, input and output tokens, spend, and average latency.
- Total Tokens — Input and output token consumption over time.
- Cost Breakdown — Spend trends for the selected period.
- Models Breakdown — Models ranked by spend or token usage.
- Users Breakdown — Users ranked by spend or token usage.
- Top Guardrail Violations — Most frequent guardrail violations.
- Model Reliability Hotspots — Successful, failed, and total requests by model.
- Cache Efficiency — Cache read activity and token usage over time.
All panels use the selected time range, making it easier to compare related cost, usage, reliability, and governance trends.
For scenario-based examples, see Use Cases — Monitor platform health.
Dashboard panel types#
Dashboards support four panel types:
- Metric cards — Display a single summary metric, such as request count, success rate, spend, or token usage.
- Chart panels — Visualize trends and comparisons over time.
- Calendar panels — Show activity by date and provide a chronological view of events.
- Table panels — Present detailed records and attributes in a structured format.
Panels can be added, resized, repositioned, and configured when building a custom dashboard.
Manage dashboards#
Create a dashboard#
-
Open Home and click + CREATE DASHBOARD.
-
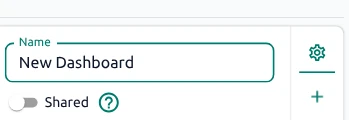
Enter a dashboard Name.
-
Optional: enable Shared to make the dashboard available to other users.
-
Configure the layout:
- Drag panels to reposition them.
- Resize panels using the lower-right resize handle.
-
Click + to add panels.
-
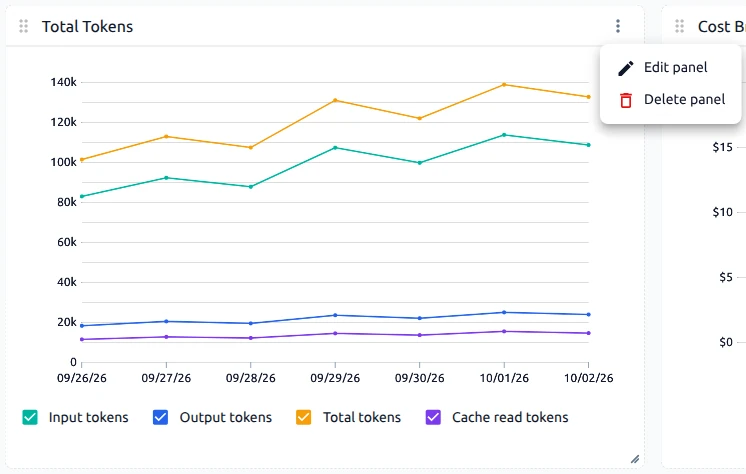
Open ⋮ → Edit panel to change panel settings.
-
Open ⋮ → Delete panel to remove a panel.
-
Click CREATE.
The new dashboard appears in the dashboard list and displays data based on the selected panels and filters.
Edit a dashboard#
-
Open Home and select the dashboard tab to edit.
-
Click EDIT.
-
Make the required changes. For example:
- Rearrange or resize panels.
- Add or remove panels.
- Update panel settings (⋮ → Edit panel).
-
Click SAVE.
The changes are saved to the selected dashboard.
Delete a dashboard#
- Open Home and select the dashboard tab to delete.
- Click EDIT.
- Click DELETE.
- Confirm the deletion when prompted.
The dashboard is removed from the list of available dashboards.