Optimizations#
Open Analytics → Optimizations to measure AI cost optimization and savings across your organization. Compare actual AI spend with the estimated cost of processing the same workloads without optimization and analyze savings from cache reads, prompt and context compression, and memory retrieval.
The page opens with summary savings metrics and a Savings breakdown chart showing savings from Cache read, Prompt compression, and Memory retrieval.
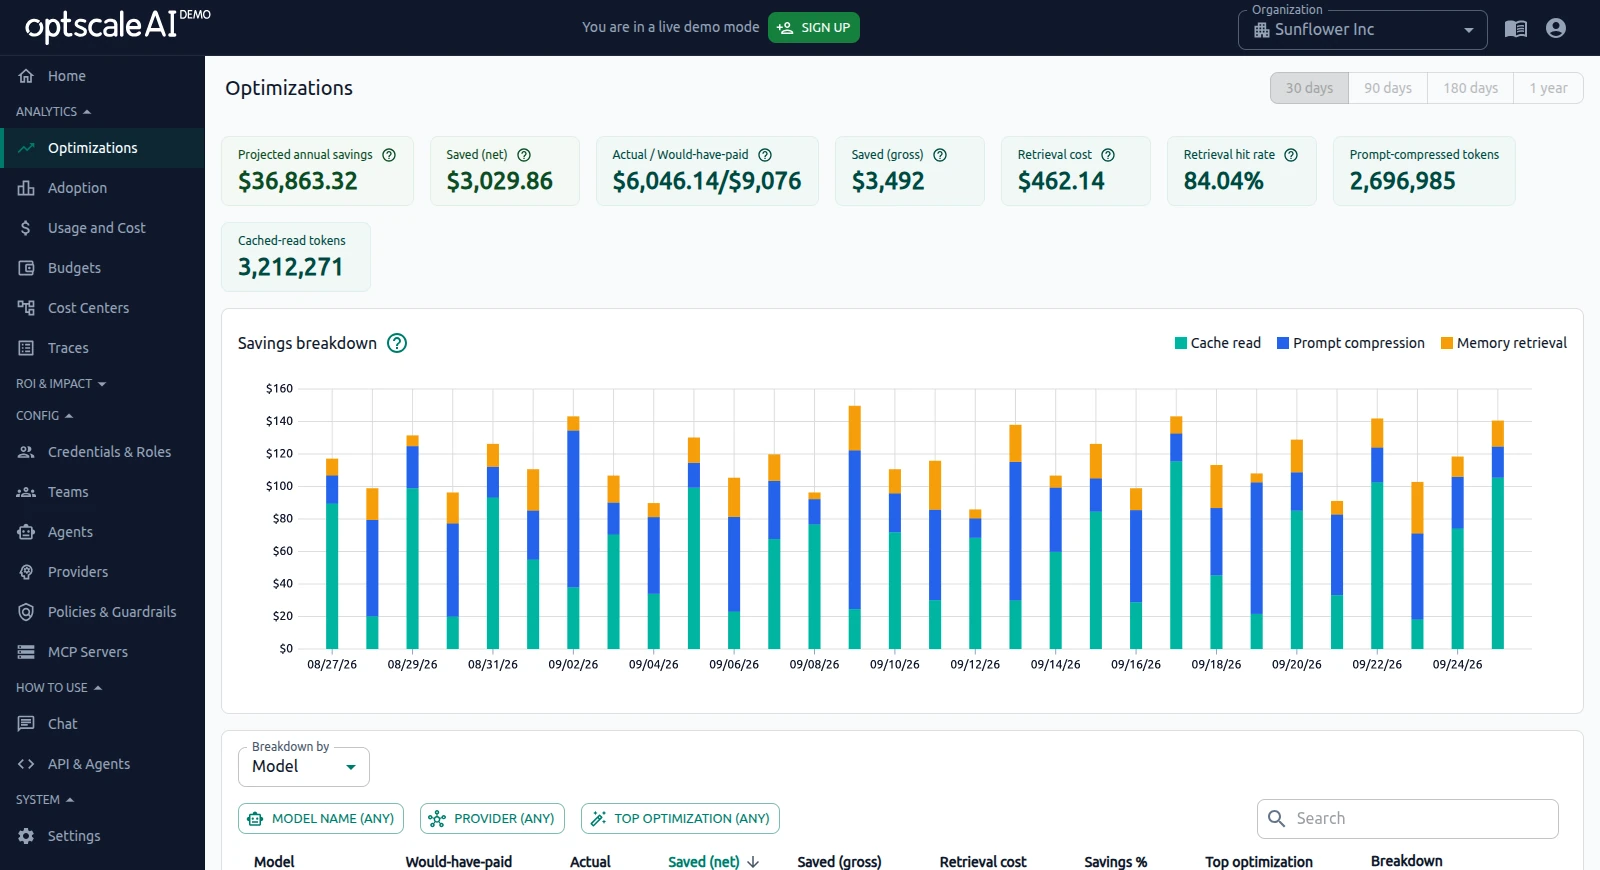
Below the chart, use Breakdown by to group the savings table. The Model grouping shows Would-have-paid, Actual, and savings for each model.
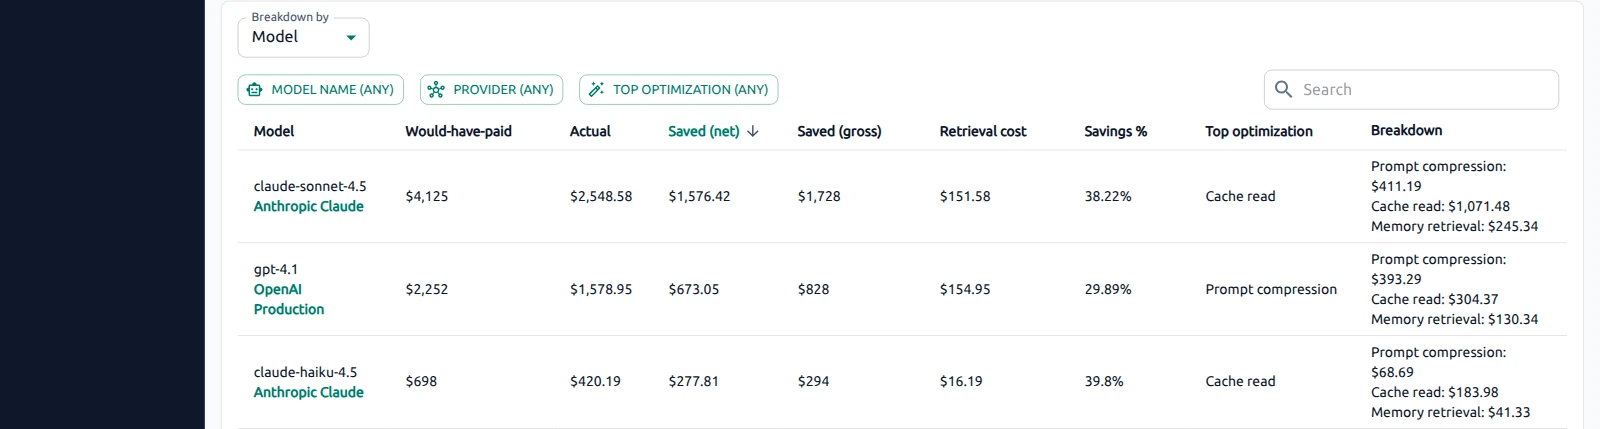
The page also provides gross and net savings, token reductions, and optimization results across models and teams.
Savings data is available when applicable optimization features are enabled and used.
For scenario-based examples, see Use Cases — Measure optimization savings.
How optimization savings are measured#
OptScale AI compares the cost of optimized AI requests with the estimated cost of processing the same workload without the applied optimization techniques.
The main savings metrics are:
- Would-have-paid — Estimated AI cost without optimization.
- Actual — AI spend after the optimization is applied.
- Saved (gross) — Cost savings before retrieval-related costs are included.
- Retrieval cost — Cost associated with retrieving reusable context or memory.
- Saved (net) — Gross savings after retrieval cost is subtracted.
Together, these metrics show both the cost avoided through optimization and the additional cost required to support retrieval-based techniques.
Projected annual savings extrapolates the observed optimization results from the selected time range to provide an estimate of potential annual savings.
Optimization metrics#
Summary cards show organization-wide optimization results for the selected time range.
In addition to the cost metrics described above, the page includes:
- Retrieval hit rate — Share of retrieval attempts that successfully reused stored context.
- Prompt-compressed tokens — Tokens removed through prompt and context compression.
- Cached-read tokens — Tokens served from cache.
Use these metrics together with Actual, Would-have-paid, Saved (gross), and Saved (net) to evaluate both cost savings and token reduction.
Savings breakdown#
The Savings breakdown chart shows cost savings over time by optimization technique:
- Cache read — Savings from reused cached context.
- Prompt compression — Savings from reducing prompt size before requests are sent to the provider.
- Memory retrieval — Savings from reusing retrieved context.
Use the chart to compare the contribution of each technique and identify changes in savings over time.
For overall AI spend and usage, see Usage and Cost.
Optimization techniques#
OptScale AI tracks savings across several optimization techniques:
- Cache reads reuse previously processed context when applicable, reducing the number of tokens that must be processed again by the model.
- Prompt compression reduces the amount of prompt and context data sent with a request.
- Memory retrieval reuses relevant stored context instead of sending larger amounts of context with every request.
The Savings breakdown chart shows how much each technique contributes to overall AI cost savings for the selected period.
Token-related metrics provide additional context:
- Cached-read tokens show how many tokens were served from cache.
- Prompt-compressed tokens show how many tokens were removed through prompt and context compression.
- Retrieval hit rate shows how often retrieval successfully reused stored context.
Model and team views#
The Model and Team views break down optimization results for the selected time range.
- Model — Compare savings and token reductions across models.
- Team — Compare savings and token reductions across teams.
For each model or team, review metrics such as:
- Would-have-paid and Actual cost.
- Saved amount and Savings %.
- Token reductions from cache reads and prompt compression.
- Primary optimization technique.
Analyze optimization results#
To review optimization performance for a selected time range:
- Start with the summary metrics to compare Actual, Would-have-paid, Saved (gross), and Saved (net).
- Review Savings breakdown to identify which optimization techniques contribute to the savings.
- Compare Model and Team views to see where savings and token reductions occur.
- Use Usage and Cost to compare savings with overall AI spend and consumption.
- Use Traces to inspect optimization behavior for individual requests.
See also#
- Usage and Cost — Compare optimization savings with overall AI spend and usage.
- Traces — Inspect optimization behavior for individual requests.
- Home — Monitor organization-wide metrics and trends.
- Context compression — Configure compression for users, teams, and agents.