ROI & Impact#
Open ROI & Impact to understand how AI usage and spend relate to engineering and business outcomes. The sidebar items Overview, Reports, Metrics, and Schedules open the matching tabs on this page.
Unlike Usage and Cost and Optimizations, ROI & Impact connects AI usage and spend with engineering and business indicators derived from data outside the gateway.
Engineering indicators show observed relationships and trends. They do not establish that AI caused a particular engineering outcome.
Overview#
How ROI & Impact works#
ROI & Impact combines AI gateway data with connected engineering and business data. Metrics transform these inputs into measurable indicators that can be reviewed in dashboards and reports.
Use ROI & Impact to relate AI spend to delivery, track AI adoption, monitor threshold crossings, and prepare recurring reports for finance or engineering leadership.
Page structure#
ROI & Impact includes the following areas:
- Overview — Review dashboards and metric results.
- Metrics — Define and manage measurable indicators.
- Reports — Group metrics for a specific audience or reporting purpose.
- Schedules — Recompute active metrics automatically.
- Configuration — Configure models, computation defaults, and data sources.
Open Configuration from the page header. Select Refresh to reload the summary cards and the contents of the current tab.
First steps#
To configure ROI & Impact for the first time:
- Open Configuration and select the required models and data sources.
- Create a dashboard from a persona preset or build one manually.
- Activate the metrics that should participate in scheduled computation.
- Compute the metrics manually or through a schedule.
- Open the dashboard and review the resulting values and trends.
Before you start, confirm that an organization is selected, at least one provider is Active with a model enabled, and gateway traffic is flowing. Check Gateway ingest and Last ingest on the summary cards.
Configure data and models#
Open Configuration from the page header and select the models and data sources required by the metrics in your first dashboard. Field-level settings are in Configuration.
Analyzer traffic is billable gateway traffic
LLM calls made by ROI & Impact route through your gateway and appear in gateway usage and cost data.
Create a dashboard#
On the Overview tab, create a dashboard from a persona preset or build one manually.
A preset creates the dashboard and creates any missing metrics required by its widgets as Draft. Existing metrics are reused without changing their status. If a required metric template is unavailable, the corresponding widget is skipped.
- On the Overview tab, click Create dashboard.
- Click Browse persona presets.
- Choose the preset that matches the audience.
- Click Create dashboard on the selected preset.
Available persona presets include:
- CEO — Adoption, delivery cost, and quality indicators.
- CFO — Spend, delivery cost, and efficiency indicators.
- CTO — Quality, adoption, review, and model-use indicators.
- Engineering Manager — Team-level delivery and threshold indicators.
The dashboard appears under Your dashboards. Widgets can appear before their metrics have values.
Activate and compute metrics#
Metrics created by a persona preset are created as Draft. Activate a metric to include it in scheduled recomputation. Activation changes the metric status but does not compute a value.
- Open ROI & Impact → Metrics.
- Find the Draft metric.
- In Actions, click Activate.
- Confirm that Status changes to Active.
Then compute the metric manually or include it in a schedule. See How computation works.
Analyze results#
On the Overview tab, open the dashboard. After its metrics have computed, widgets show the latest results.
Depending on the widget, you can review:
- The metric name and latest value.
- Widget type — for example, Time series or Single stat.
- Type — whether the metric is deterministic or model-scored.
- Sample size — how many records contributed to the result.
- Data freshness — when the value was last computed, when freshness stamps are enabled.
Use Single stat widgets for current values and Time series widgets for changes over time. Grouped time series can compare categories such as teams. Groups smaller than Minimum group size are hidden; see Minimum group size.
If a widget has no value, see Troubleshooting.
Metrics#
Metrics are the core unit of ROI & Impact. Each metric defines an indicator computed from gateway data, connected-system data, or both.
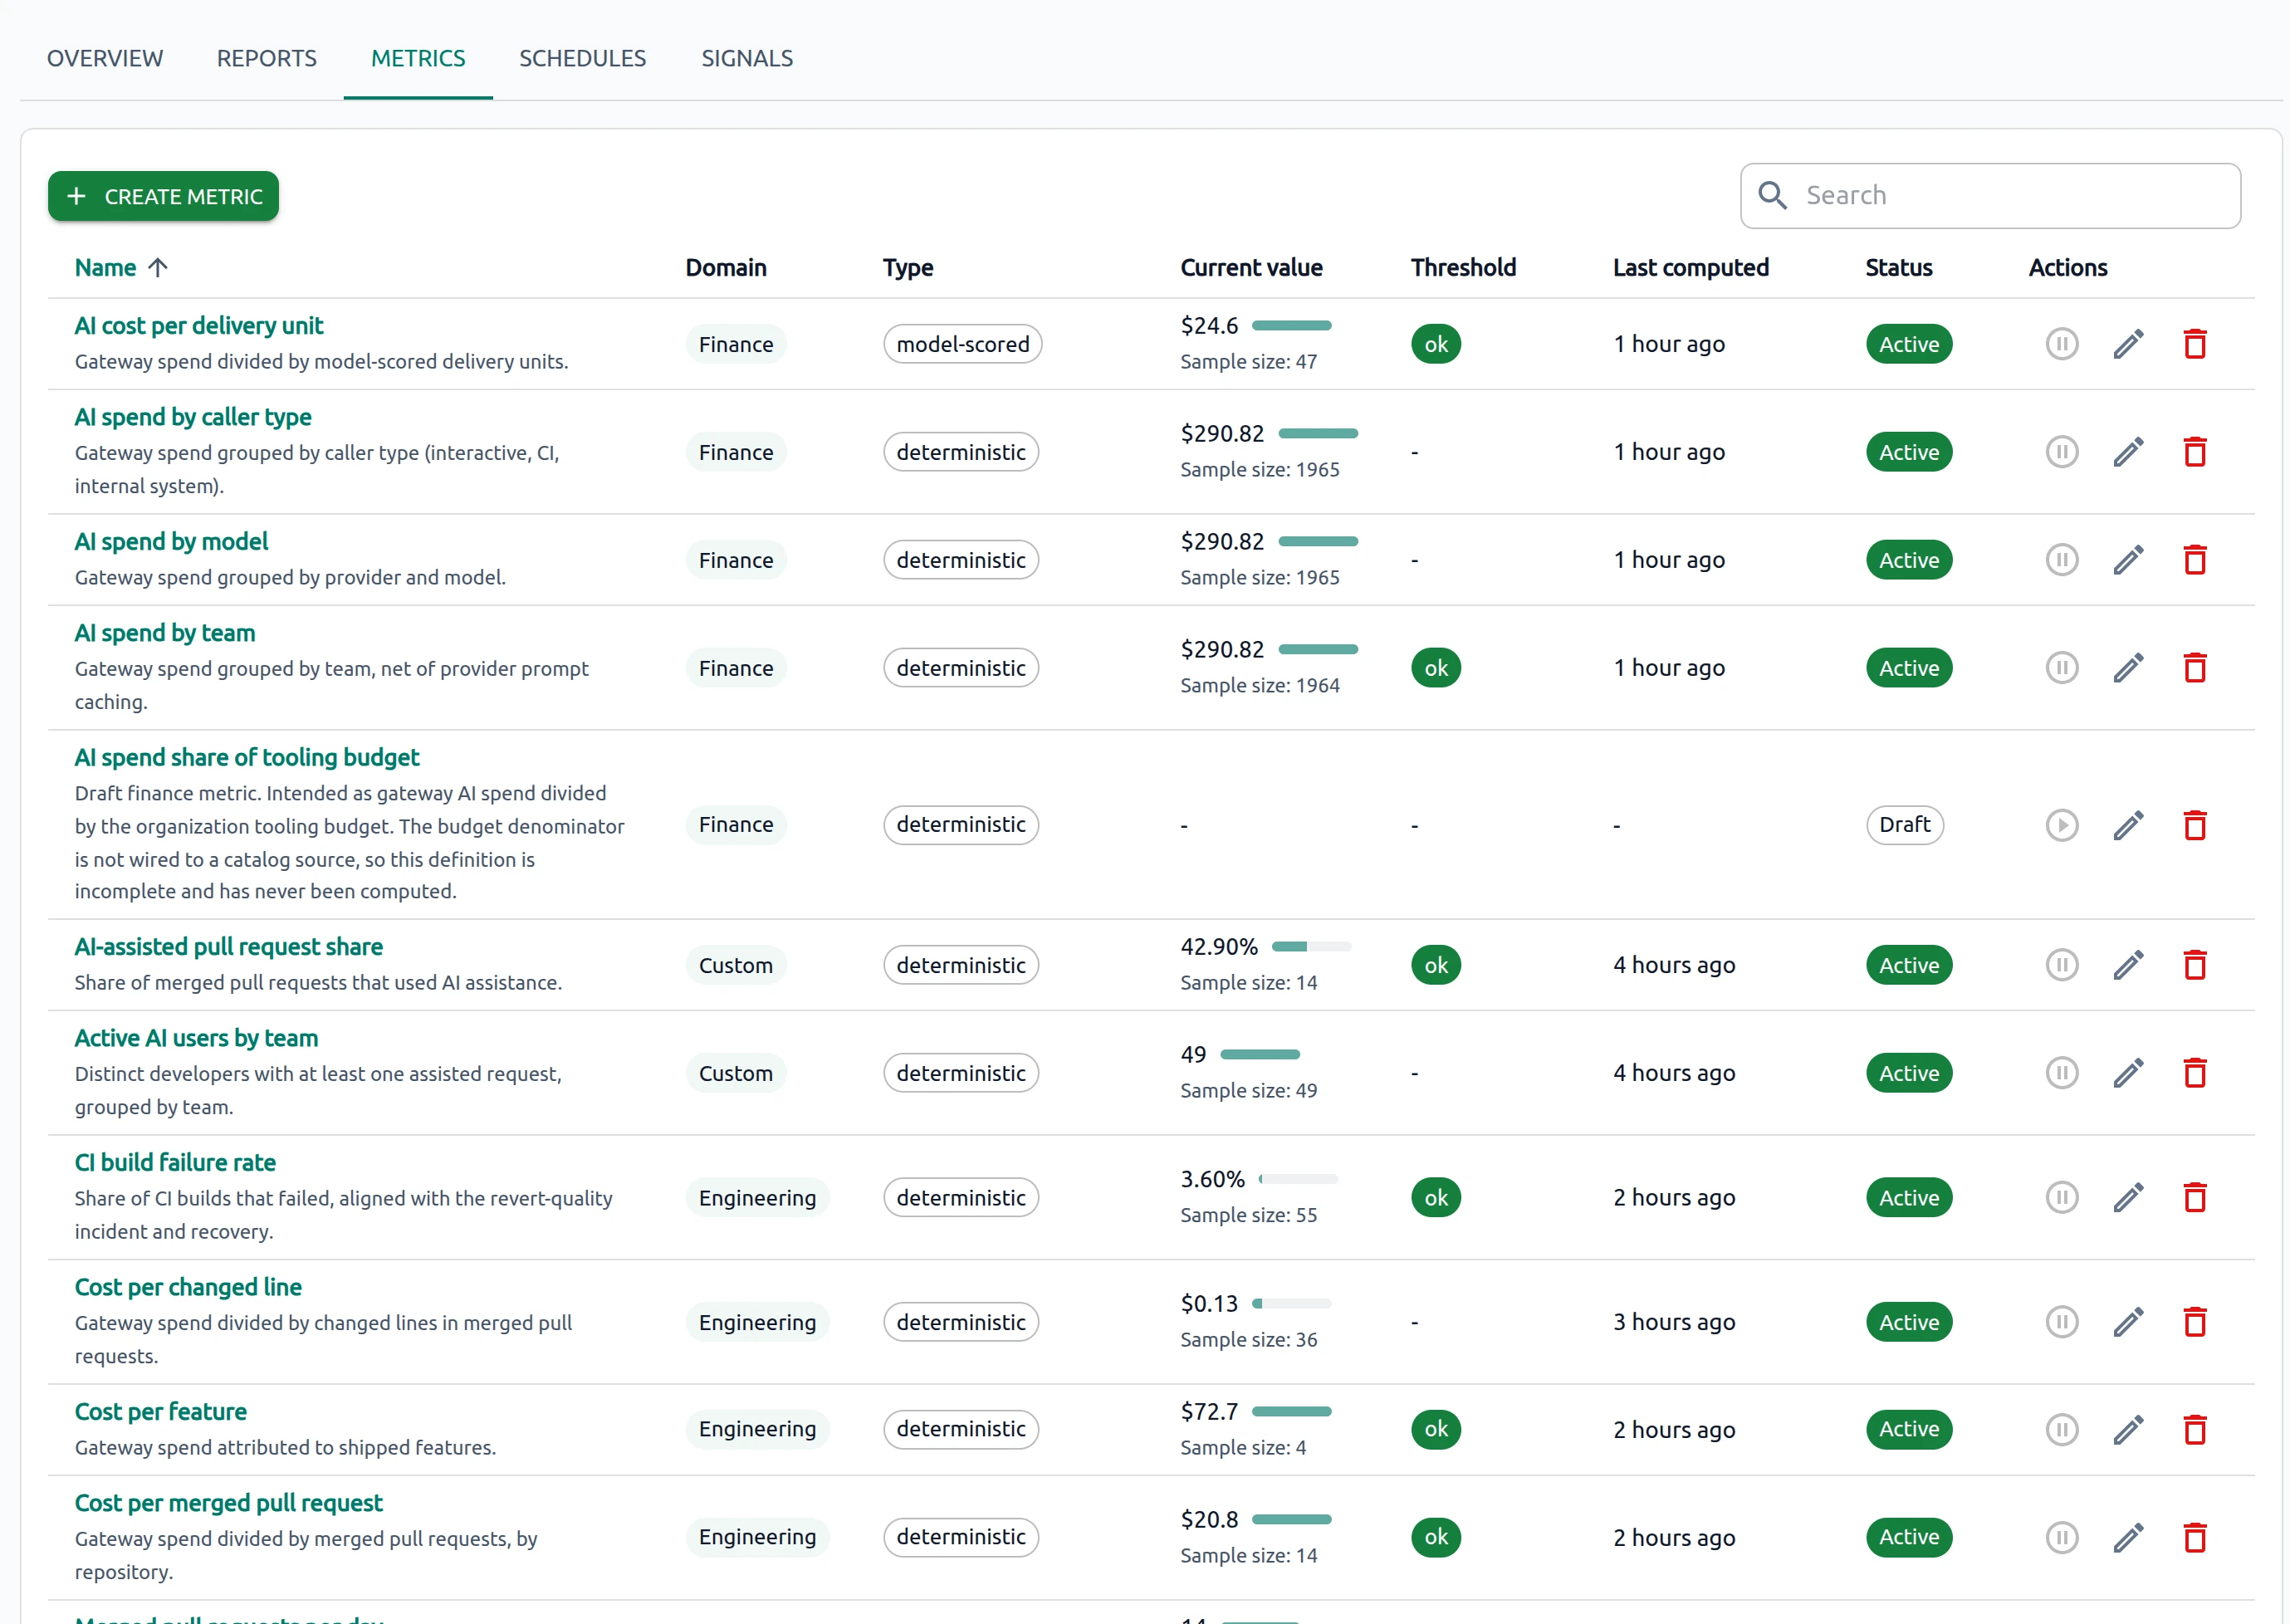
Each row can include:
- Domain — The reporting area, such as Finance, Engineering, or Custom.
- Type — How the metric is computed.
- Current value — Latest computed result.
- Sample size — Number of records that contributed to the result.
- Threshold — Whether the latest result is within the configured bounds.
- Last computed — When the metric was last computed.
- Status — Active (included in scheduled recomputation) or Draft (saved, not scheduled).
- Actions — Controls such as Activate/Pause, Edit, and Delete. Available actions depend on the metric status.
Metric types#
Deterministic metrics compute results directly from source data using their configured computation.
Model-scored metrics use model-scored source data, such as delivery-unit scoring. Model-scored delivery units are intended for tracking trends within your organization and should not be used as a cross-company benchmark.
The classifier model configured in General is not the model that calculates a model-scored metric value.
Create a metric#
- Open ROI & Impact → Metrics.
- Click + CREATE METRIC.
- Choose a predefined template or define a custom metric.
- Configure its computation, thresholds, and cadence.
- Save the metric as Draft or activate it.
How computation works#
Metric computation is controlled at three levels:
- Computation defaults — Set the default cadence for newly created metrics.
- Metric settings — Store the cadence configured for an individual metric.
- Schedules — Create recurring tasks that recompute selected Active metrics.
Changing a metric to Active does not compute it immediately. Run the metric manually or include it in a schedule.
Changing the default cadence does not update existing metrics or trigger computation. The cadence stored on a metric does not create a recurring task by itself.
Verify a metric#
After creating or changing a metric:
- Review its status and definition.
- Open Configuration → Data Sources and confirm that each required connector shows a connected state.
- Compute the metric manually or run a schedule that includes it.
- Confirm that Current value and Last computed are populated.
- Review Sample size.
- Open the metric detail page to review its trend, validation status, and diagnostics.
Metric detail page#
Open a metric to review its trend, validation status, and computation diagnostics.
Use diagnostics when a value is missing or unexpected. Validation findings can identify conditions such as an empty or very small sample or records excluded by configured rules.
Edit a metric#
- On the Metrics tab, locate the metric.
- In Actions, click the
 Edit icon.
 - Update the available fields and save.
- Recompute the metric to produce a value using the updated settings.
Delete a metric#
Before deleting a metric, check whether it is referenced by a dashboard, report, or schedule.
- Open ROI & Impact → Metrics.
- In Actions, click the
 Delete icon.
 - Confirm the deletion.
To keep the definition but exclude it from scheduled recomputation, leave it as Draft.
Dashboards#
Use the Overview tab to open dashboards and review metric results.
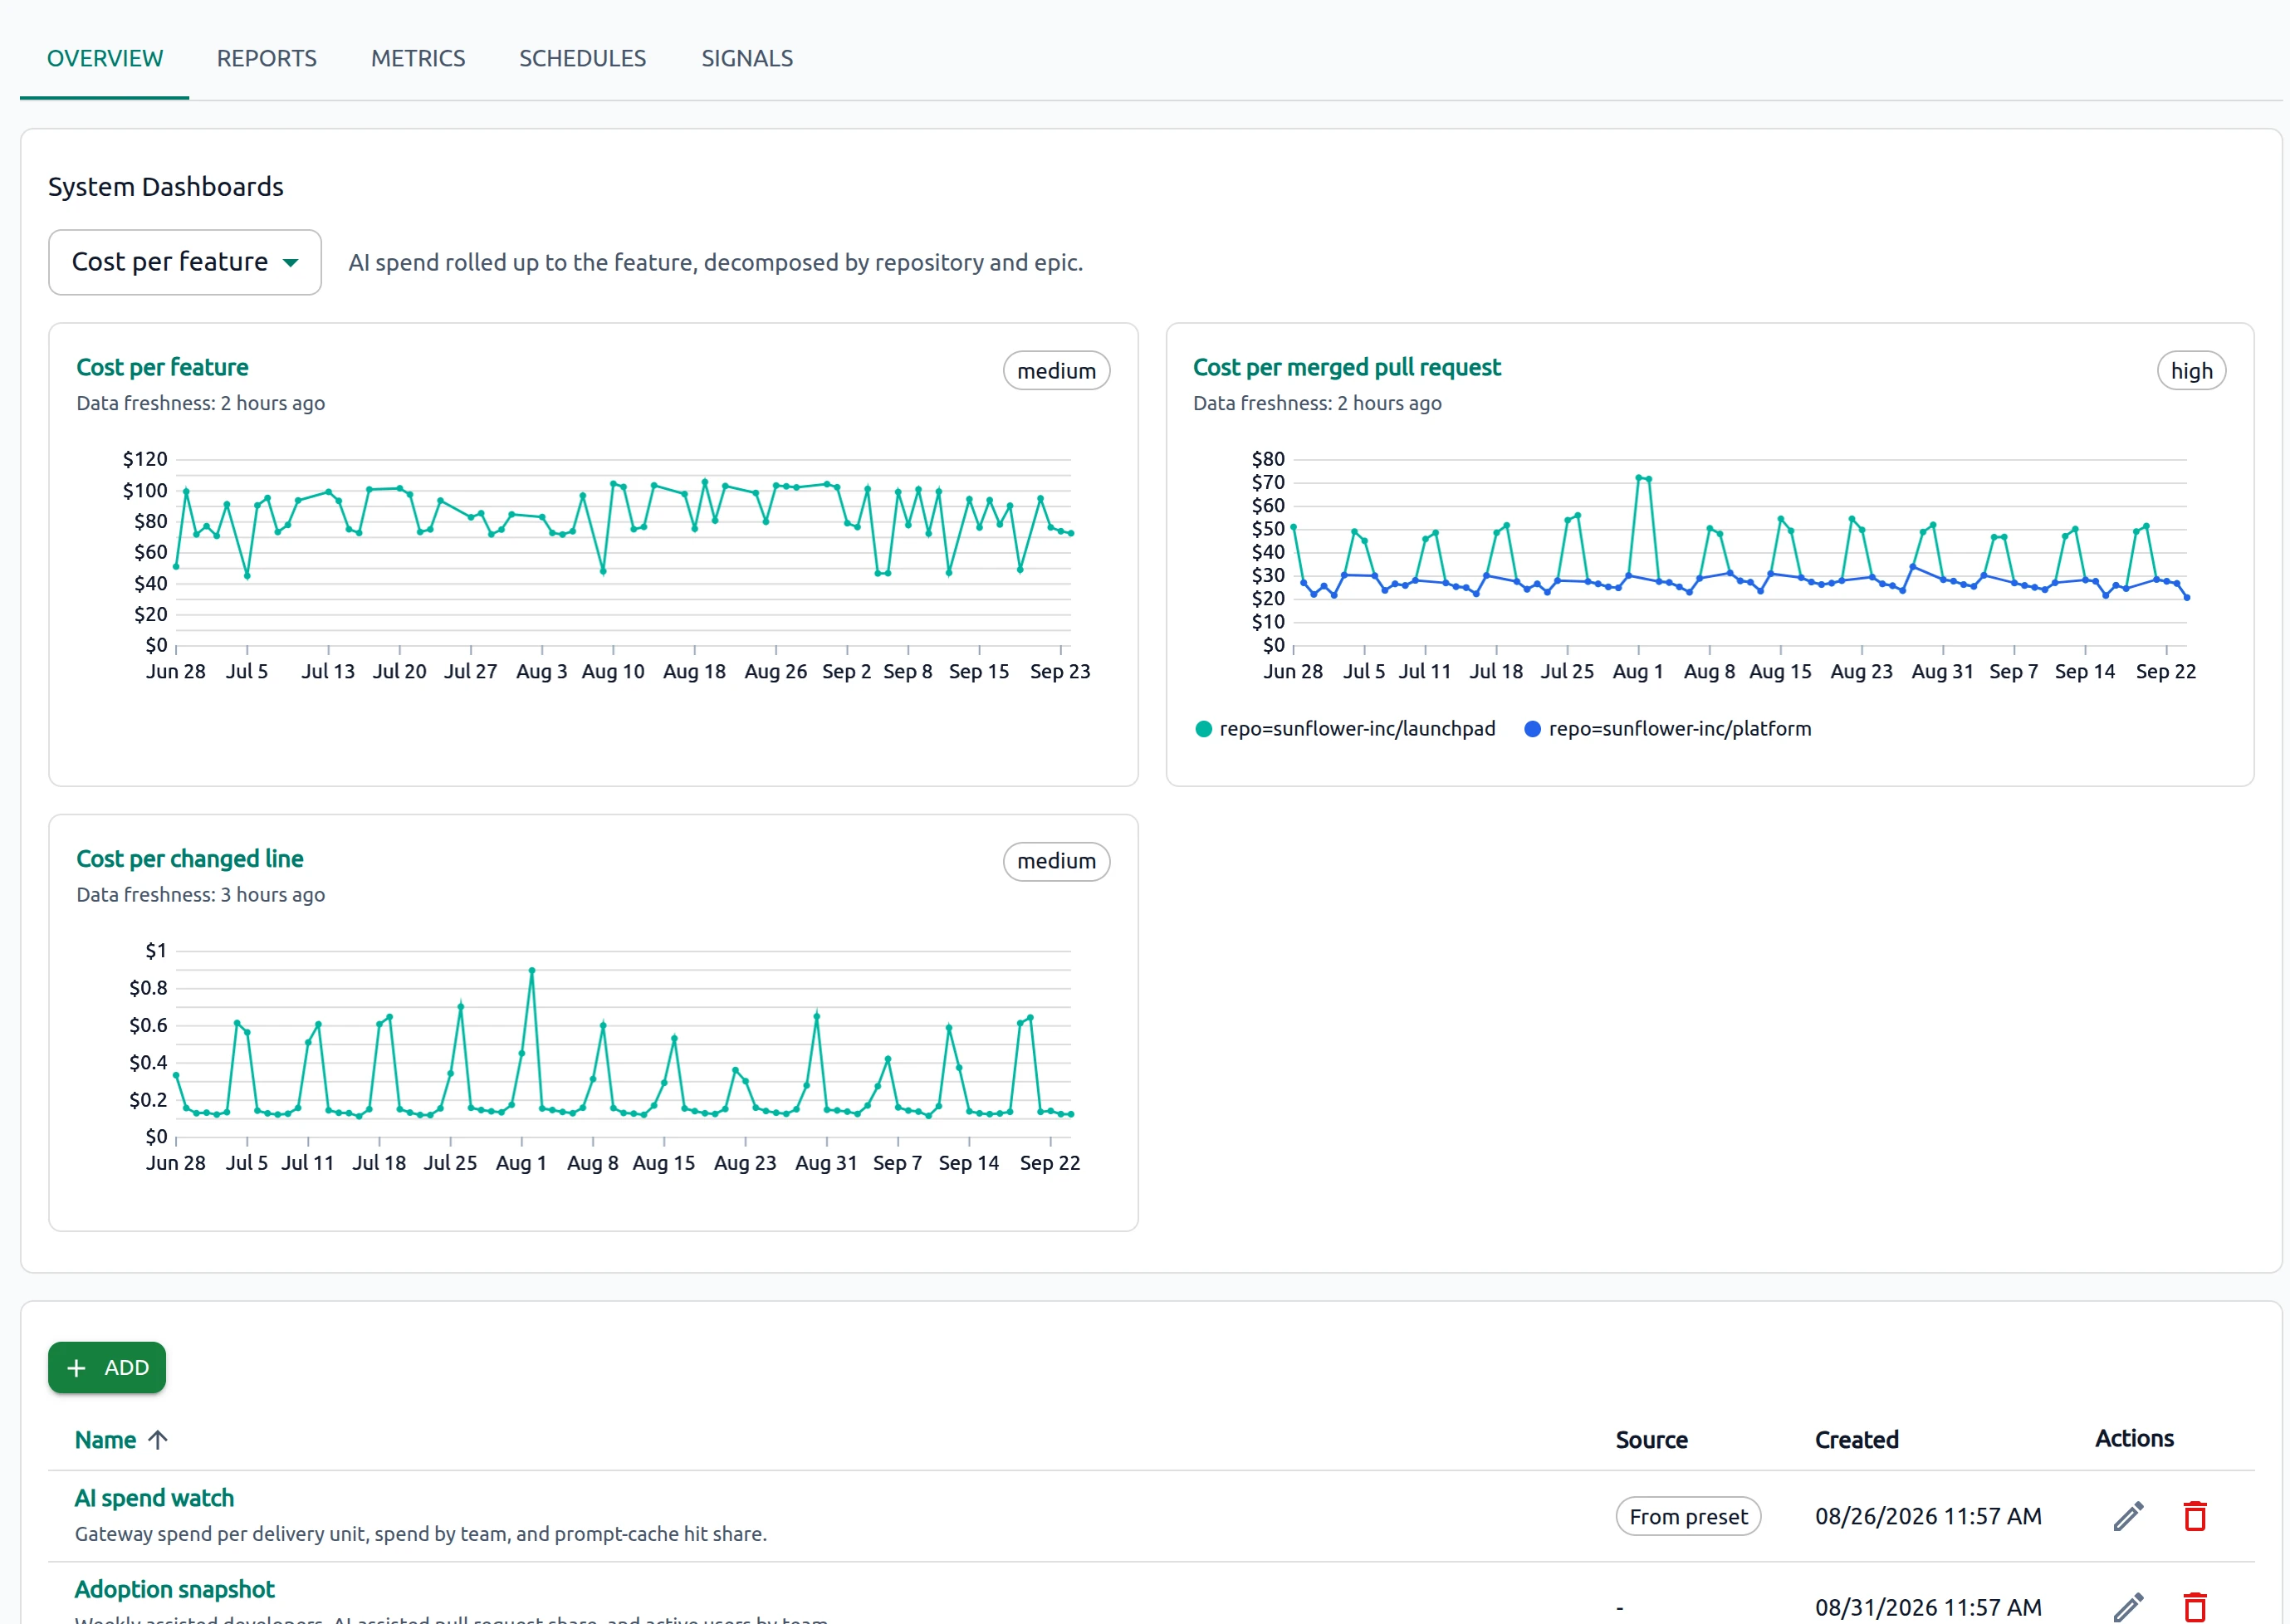
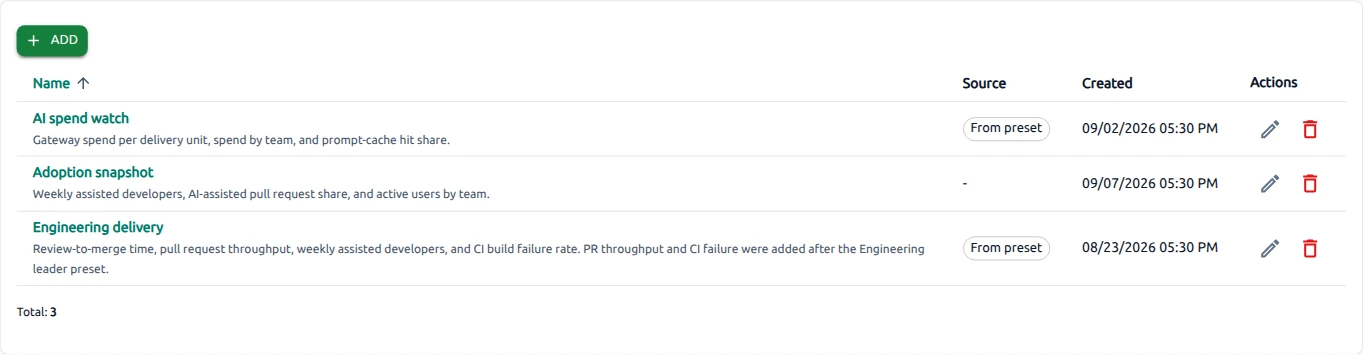
System Dashboards provide predefined views of AI spend, adoption, and engineering indicators. Your dashboards contain dashboards created by users, either manually or from a persona preset.
Open a dashboard to review its widgets. Depending on the dashboard configuration, you can add, remove, or rearrange widgets and include metrics that you created separately.
Create a dashboard without a preset when you already know which metrics and widgets you need. Use a persona preset when you want a predefined starting point.
Reports#
Use the Reports tab to save a set of metrics for a particular audience and review their latest values.
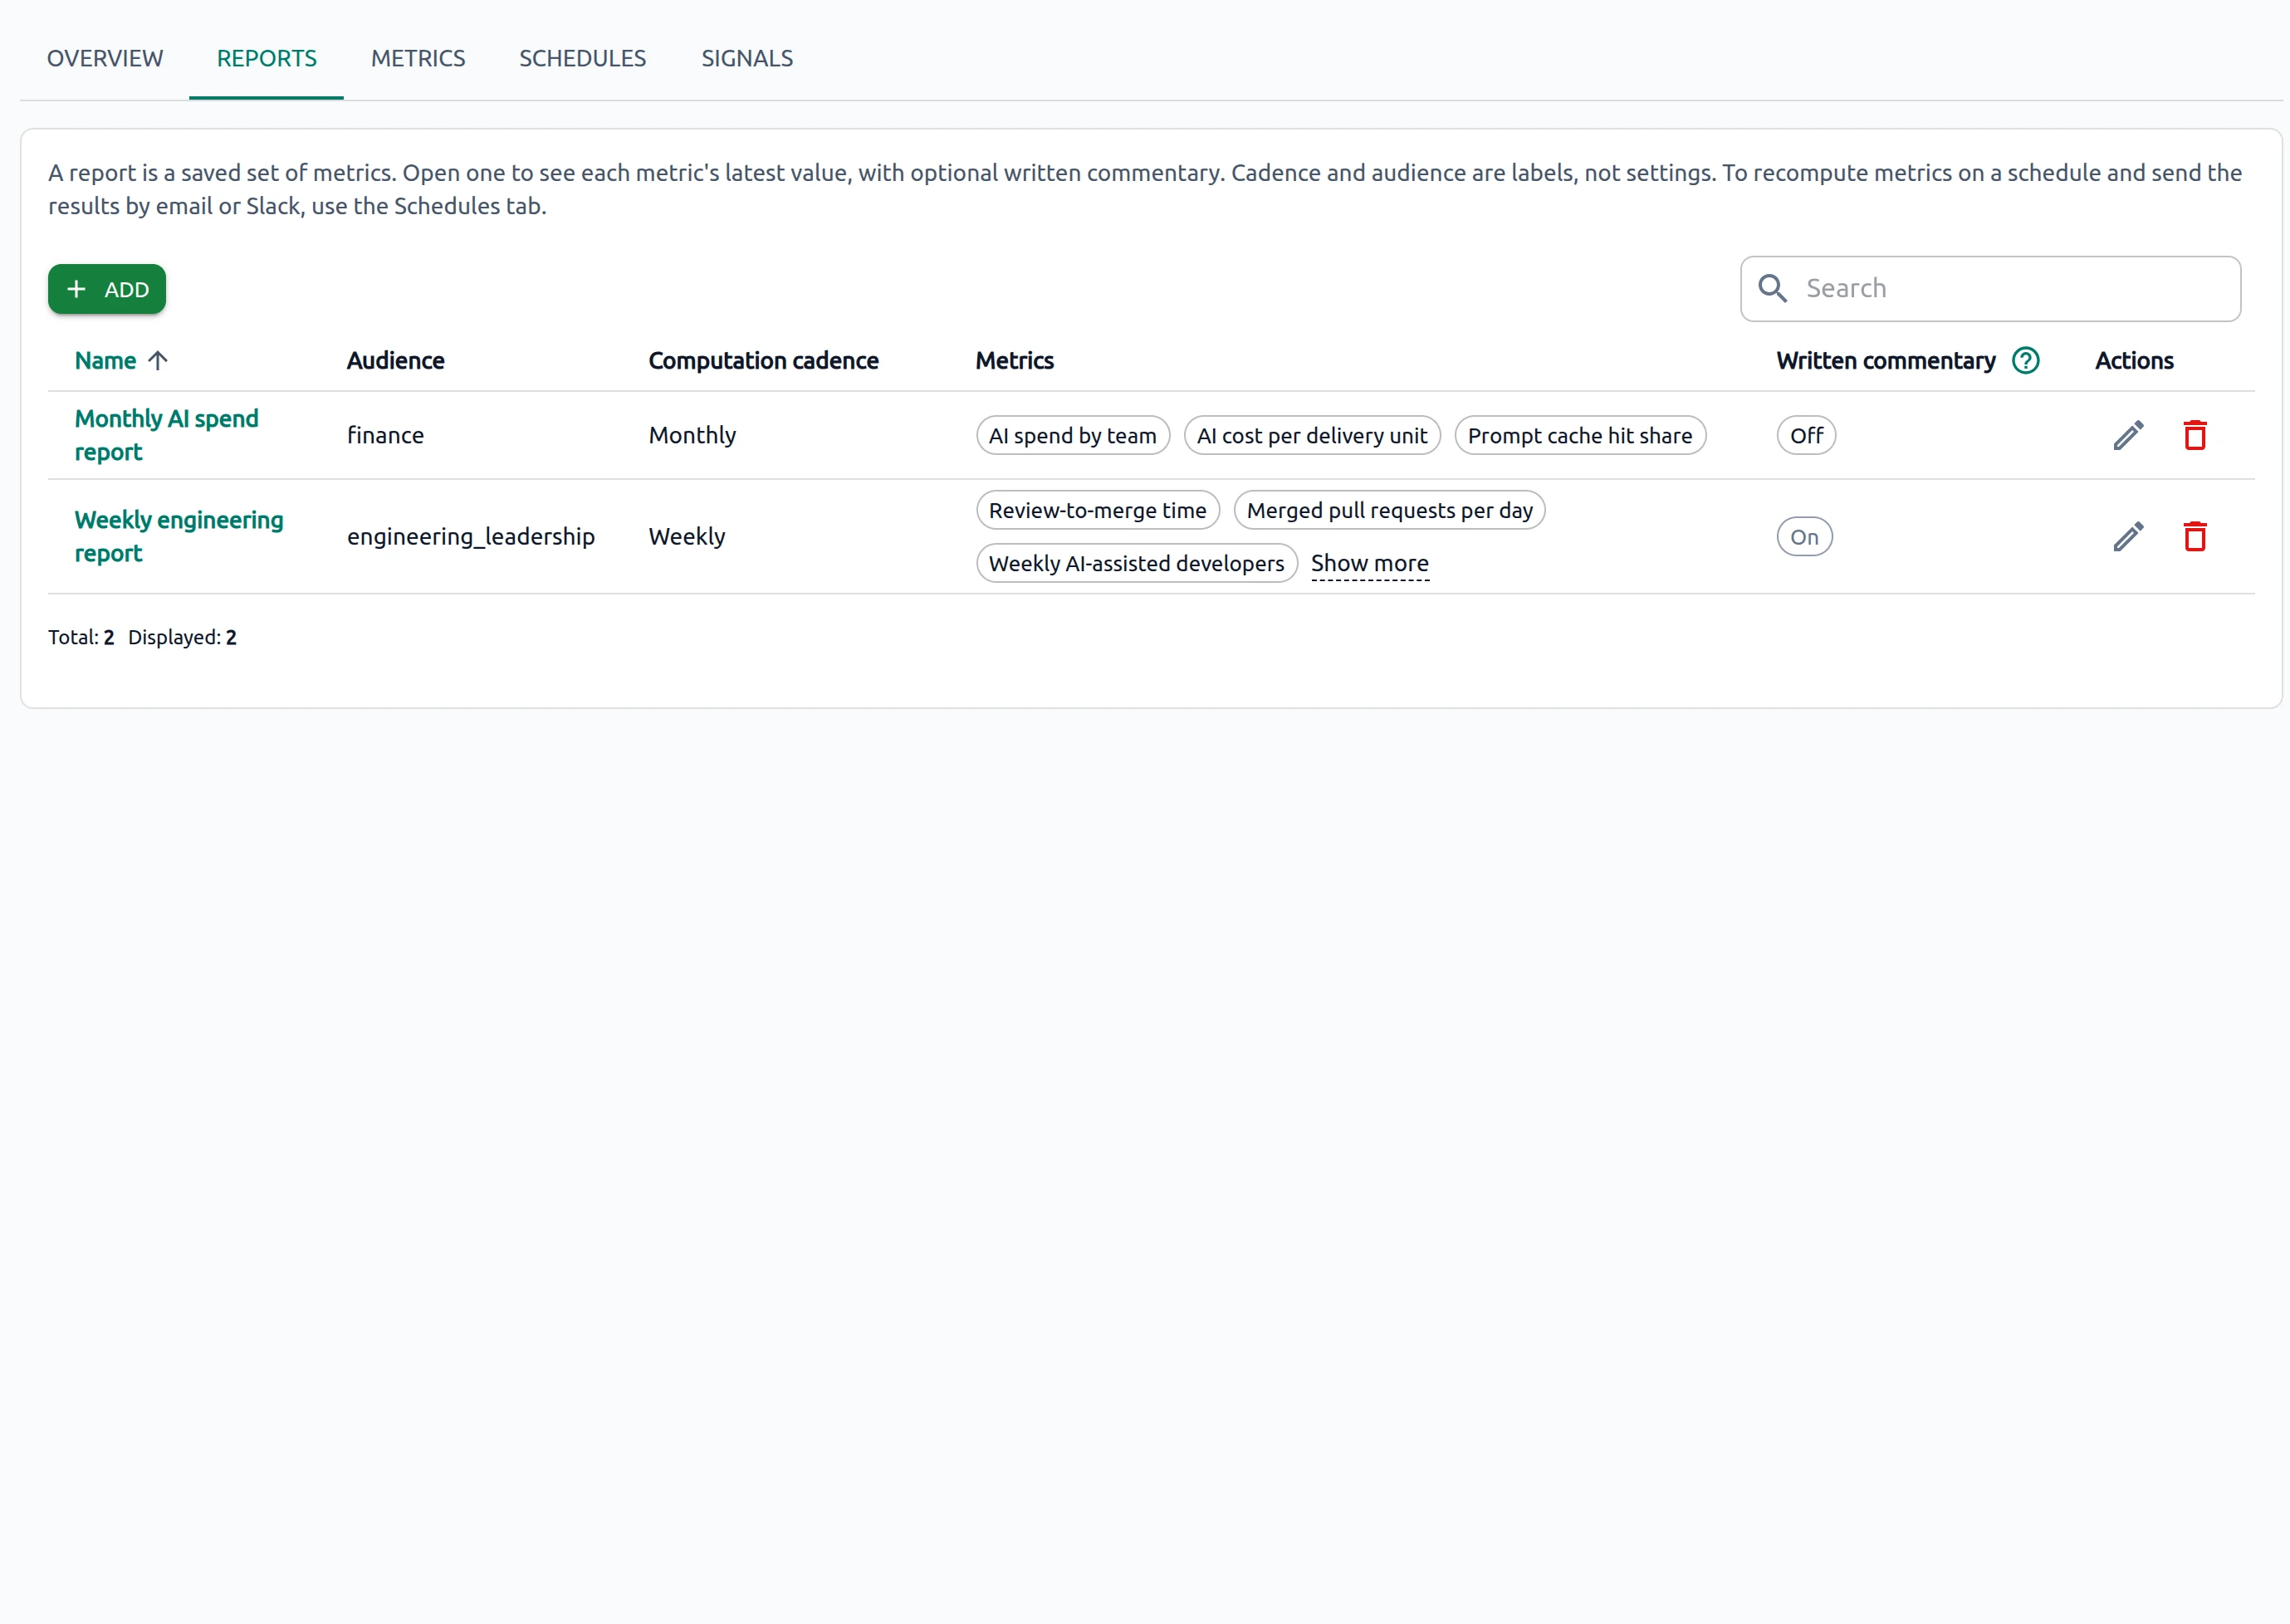
Each report includes Name, Audience, Computation cadence, Metrics, and optional Written commentary.
Audience and Computation cadence describe the report. They do not schedule metric computation. To recompute metrics automatically, use Schedules.
To create a report:
- Click + ADD.
- Enter a name.
- Set the audience and cadence labels.
- Select the metrics to include.
- Optionally enable Written commentary.
- Save the report.
Written commentary uses the configured reasoning model. Group metrics according to the decision or audience the report supports.
Schedules#
Use the Schedules tab to recompute selected Active metrics automatically.
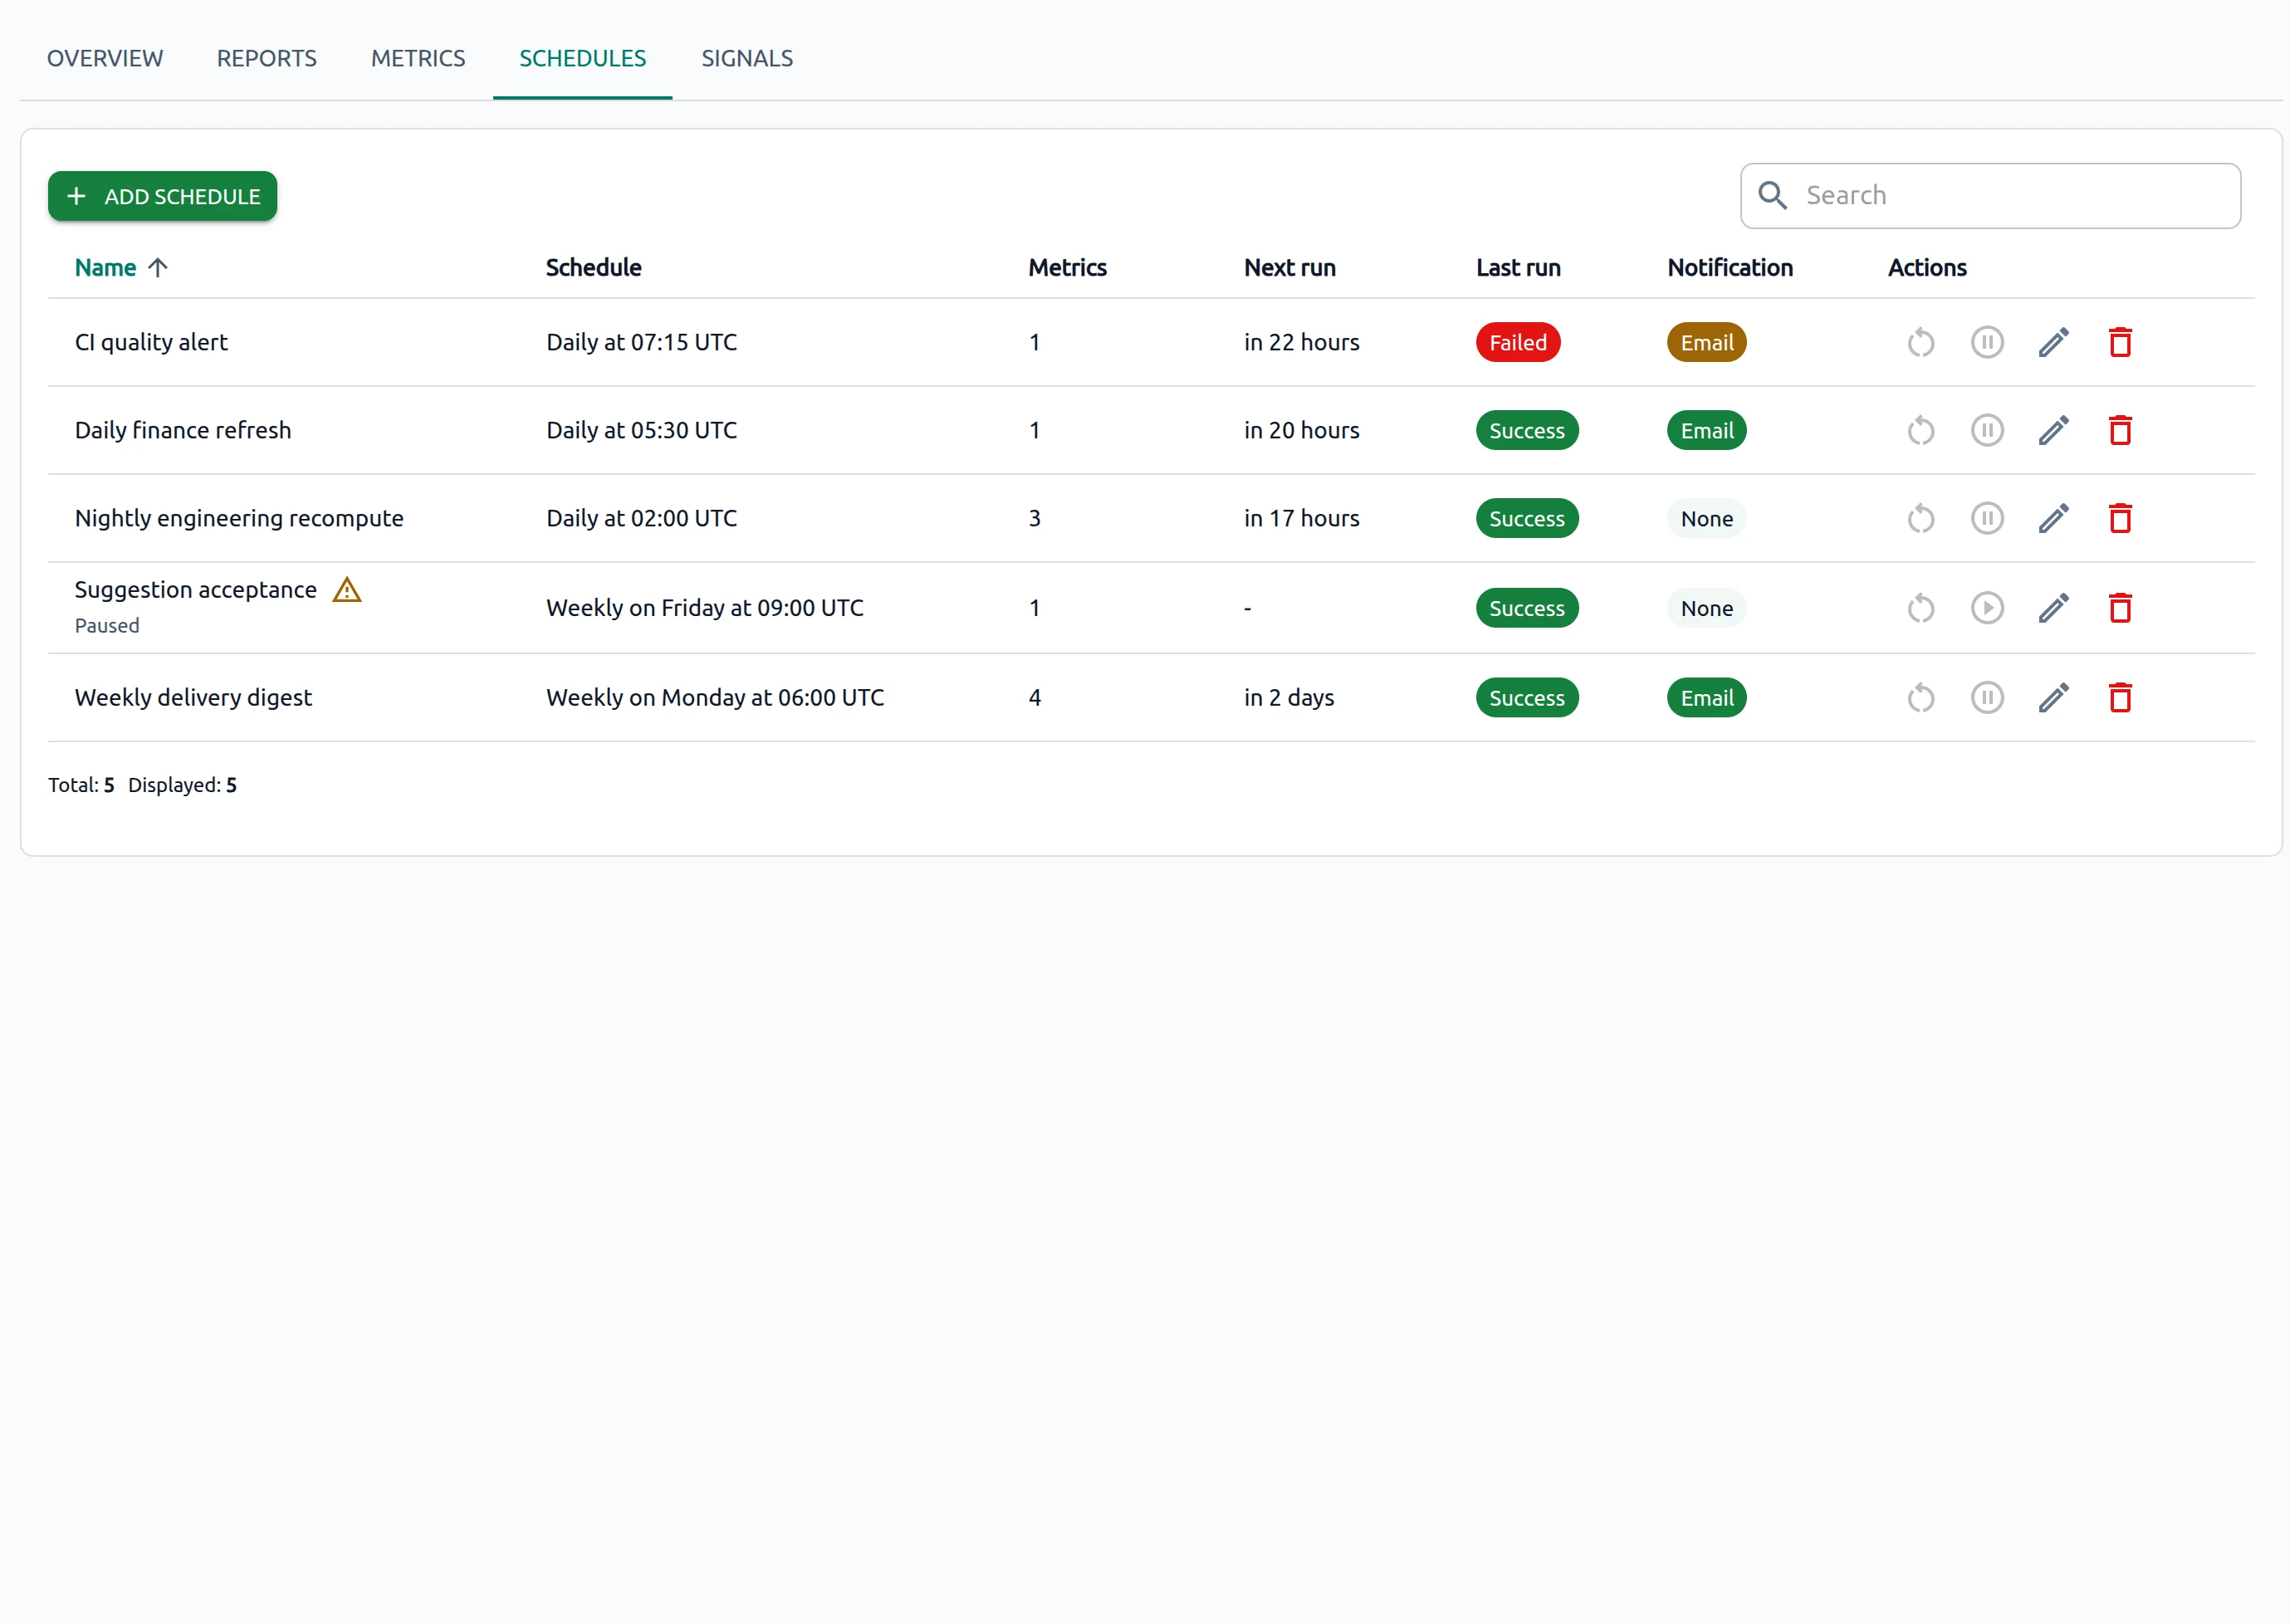
Each schedule defines when its metrics run. You can also configure an optional email or Slack summary after each run. Threshold status is included in the run result; a threshold breach does not create a separate schedule notification.
To add a schedule:
- Click + ADD SCHEDULE.
- Enter a name and configure when the schedule should run.
- Select the Active metrics to recompute.
- Optionally configure an email or Slack notification for completed runs.
- Save the schedule.
In the schedule row, click Run now in Actions to trigger the task without waiting for the next scheduled run.
The Slack destination uses the organization Slack webhook configuration. Email recipients are configured for the task.
Configuration#
Use Configuration to set organization-level defaults and connect the data required by ROI & Impact.
General#
Use General to configure models, computation defaults, organization-wide signal selection, notification destinations, SCM settings, and reporting controls.
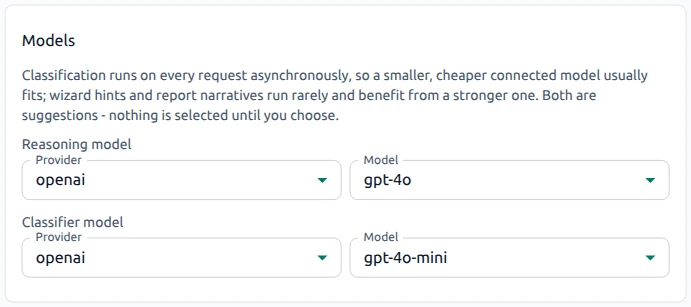
Models#
- Reasoning model — Used for features such as report narratives and other reasoning-assisted operations.
- Classifier model — Used for supported classification operations during analysis.
Only available models from configured providers can be selected.
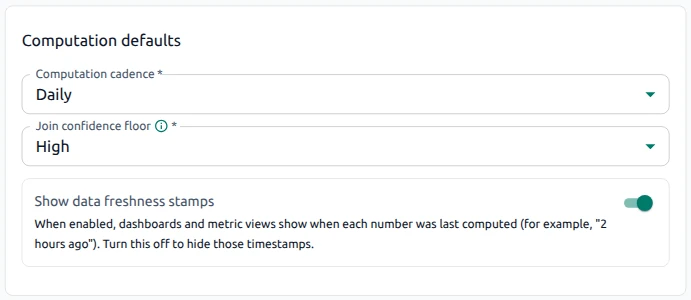
Computation defaults#
- Computation cadence — Default cadence assigned to newly created metrics. See How computation works.
- Join confidence floor — Minimum confidence accepted when joining gateway activity with delivery records. Raising the value accepts fewer, higher-confidence joins; lowering it can include more lower-confidence joins.
- Show data freshness stamps — Controls whether metric and dashboard views display when values were last computed.
Data sources#
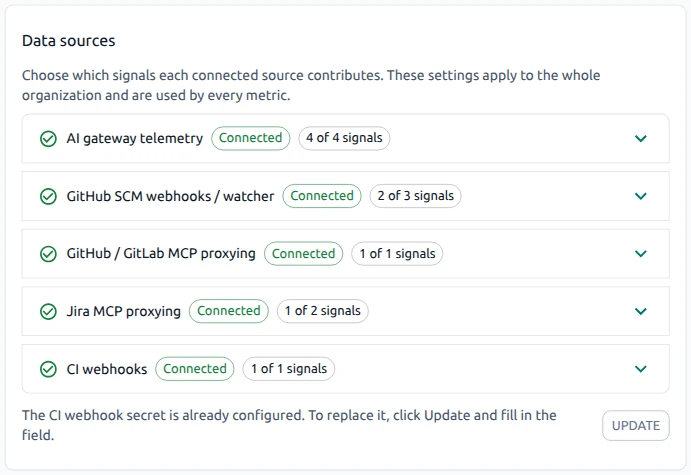
Use Data sources on the General tab to choose which signals each connected source contributes to ROI & Impact. These selections apply to the whole organization and are available to every metric.
Each source shows its connection state and the number of selected signals, for example 4 of 4 signals. Expand a source to review its signal selection.
This section controls analysis inputs. To configure a connector, use the Data Sources tab.
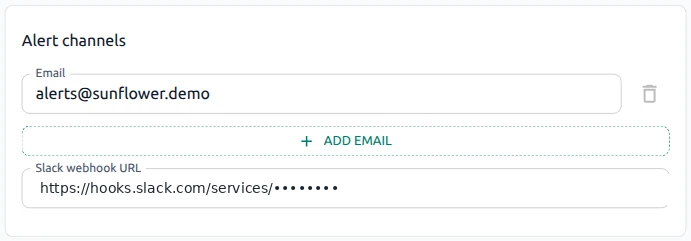
Alert channels#
- Email — Organization email destinations available to notification features.
- Slack webhook URL — Slack destination used by scheduled run notifications.
Email recipients for a scheduled run are configured on the schedule itself.
SCM watcher#
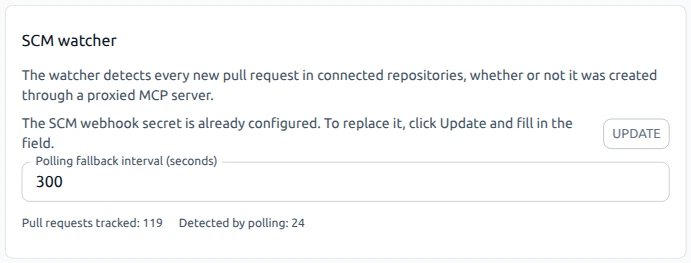
The SCM watcher collects supported pull-request data from configured SCM integrations. Pull requests can be detected through supported SCM webhooks. A polling path is also available for supported GitHub/MCP configurations.
- Pull requests tracked — Number of pull requests currently tracked.
- Detected by polling — Number of tracked pull requests whose detection source is polling.
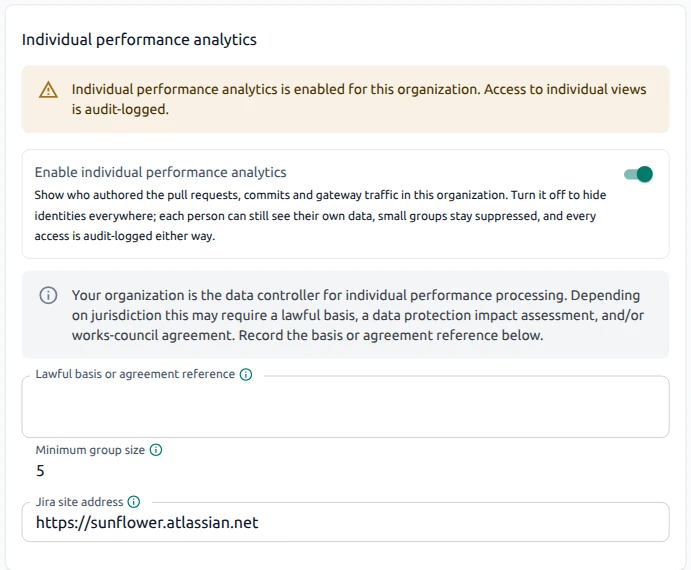
Minimum group size#
Minimum group size is the minimum group size required to display aggregated data. Aggregates smaller than this value are hidden to prevent individuals from being identified from small groups. The value is set by the platform and cannot be changed here.
Data sources#
Use Data Sources to review the external data sources used by metrics, such as SCM, CI, and issue-tracking integrations.
Each connector shows its type, metric usage, and connection state.

This tab manages connector-specific setup and shows which metrics use each connector. Organization-wide signal selection is under General → Data sources.
Connector-specific webhook integrations can have their own payload URL and secret. MCP-based sources are configured through MCP Servers.
For CI events, only finished builds are materialized as build records. Other accepted events can still be retained as signals.
A connector with no metrics using it can remain connected but show a metric count of 0.
Webhooks#
Use Webhooks to configure the organization endpoint for supported inbound events.
Accepted events that pass verification can be stored as signals and used by metrics. Requests that are rejected, invalid, duplicated, or used only as ping events are not stored as normal signals.
The page includes:
- Payload URL and Secret for the organization endpoint.
- What has arrived — Event types, delivery counts, and the most recent arrival time.
- Diagnostics log — Troubleshooting information about recent processing activity.
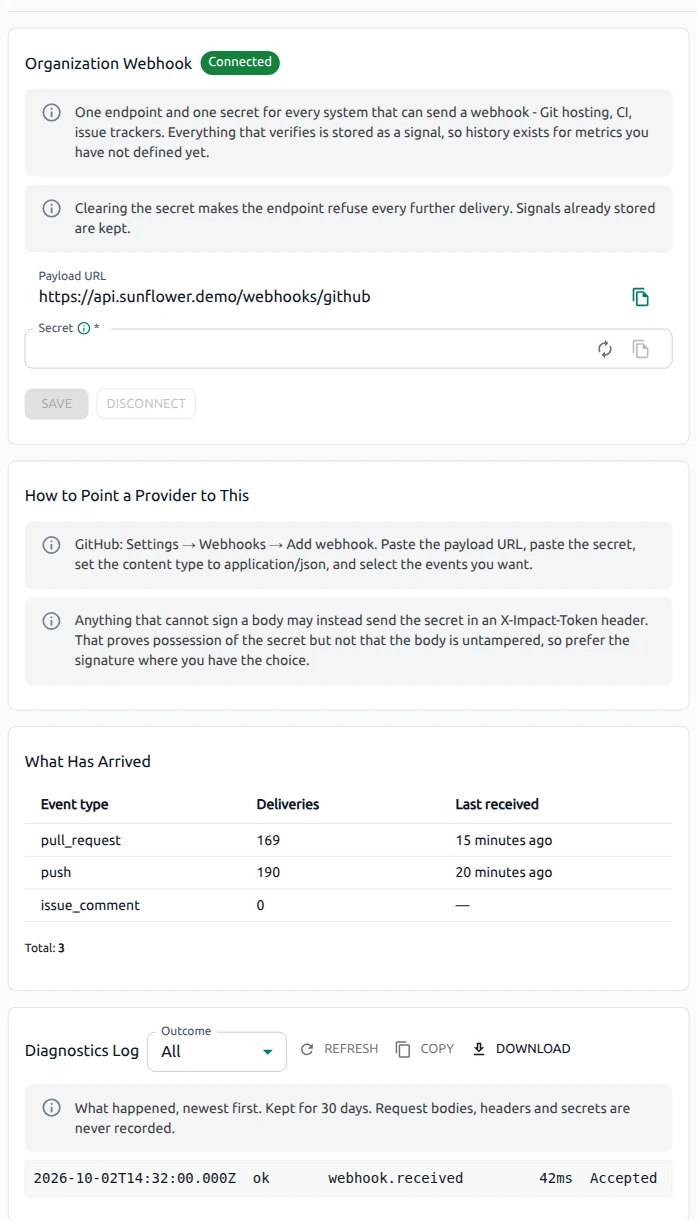
Stored signals provide source data for analysis; diagnostics help investigate processing problems.
Connector-specific SCM and CI webhook endpoints can have behavior different from the organization endpoint. Use Data Sources to configure those connectors.
Monitor ROI & Impact health#
Summary cards at the top of the page show the current state of the analysis pipeline. Select Refresh to update the cards and the current tab. A pointer icon means the card is a shortcut.
- Active metrics / Threshold alerts — How many metrics are active, and how many of those breach a threshold. Opens the Metrics tab.
- Active schedules — Schedules currently enabled. Opens the Schedules tab.
- Data feeds — Connected data sources out of the configured total. Opens Configuration → Data Sources.
- Gateway ingest / Last ingest — Gateway event volume and the most recent ingest. Opens AI spend overview in System Dashboards.
- SCM ingest / Last PR detected — SCM activity and the most recently detected pull request. Opens Configuration → General (SCM watcher).
Use these indicators when a dashboard value is missing or outdated.
Troubleshooting#
A metric or dashboard widget has no value
- Confirm that the required data sources are connected.
- Compute the metric, or confirm it is Active if a schedule should run it.
- Review the metric detail page for validation findings and diagnostics.
- A dashboard can show a Draft metric or a metric that has not yet produced a value.
Expected records are missing
- Review the configured Join confidence floor.
- Lowering the floor can include more records but also accepts lower-confidence joins.
- Review the metric diagnostics to determine whether records were excluded.
Values are outdated
- Check Last ingest and the metric's last computation time.
- Select Refresh to reload the page.
- Recompute the metric or use Run now on its schedule.
A schedule does not run
- Confirm that the schedule is enabled.
- Confirm that the metrics included in it are Active.
- Use Run now to test the task immediately.
A team or group is missing from a dashboard
- Groups smaller than Minimum group size are hidden. See Minimum group size.
See also#
- Usage and Cost — Compare ROI indicators with aggregate AI spend and usage.
- Optimizations — Review AI cost savings from optimization techniques.
- MCP Servers — Configure MCP-based data sources used by ROI & Impact.
- Providers — Configure the models used for analysis.